Is 2–0 really the most dangerous lead?
We studied 15,340 matches across nine seasons to separate losing a lead from losing a match—and show how time and team strength change the picture.
Everton were 2–0 ahead when Bournemouth began their comeback in the 87th minute on 31 August 2024. They lost 3–2. The Premier League's account makes uncomfortable reading for anyone who has relaxed with their team two goals up.
But how often does a two-goal lead actually disappear? And when it does, how often does that cost the match?
Our expanded study finds that teams first reaching 2–0 were subsequently equalised against in 10.5% of cases, but lost only 2.5% of the matches. At the same match-time checkpoints, two-goal leaders also won much more often than one-goal leaders. The memorable collapse is a real possibility; it is not the typical outcome.
Study updated 27 September 2026. This replaces our earlier 2017/18-only analysis. That open dataset made the first version reproducible, but one season was too narrow for the article's scope. The main study now contains 15,340 matches across 2017/18–2025/26, drawn from the men's Premier League, LaLiga, Serie A, Bundesliga and Ligue 1. It covers 43 of the 45 league-season combinations; two fail our coverage rule and are tested separately below.
What does “losing a lead” mean?
A team leading 2–0 can concede to 2–1 and still stay ahead. It can be pegged back to 2–2 and recover to win 3–2. Or it can lose 3–2. Those are different football experiences, and they need different counts.
We distinguish being equalised against, dropping points through a draw or defeat, and losing the match. “Caught” means the opposition later drew level, even if the original leader had first extended its advantage. A side going from 2–0 to 3–0 and then 3–3 still lost its lead.
We also ask two separate questions. First, what happened to teams ahead at the same points in a match: through recorded minute 30, at halftime, through minute 60 and through minute 75? Second, what happened after a team first reached a two-goal advantage, whenever that occurred?
The first comparison gives the teams a similar amount of match time remaining. The second follows the experience fans recognise: “We've just gone 2–0 up—what happened next?” They have different denominators and should not be blended.
Our records use whole minutes. “Through minute 60” includes goals labelled 60; it does not mean an exact 60:00 freeze. Halftime includes first-half stoppage time. We test alternative minute boundaries rather than pretending to have second-by-second precision.
At the same match time, two goals was much safer than one
Through recorded minute 60, 2,371 of 2,564 two-goal leaders won: 92.5%. There were 148 draws and 45 defeats. One-goal leaders won 4,659 of 6,580: 70.8%, with 1,444 draws and 477 defeats.
So a two-goal leader dropped points in 7.5% of cases and lost in 1.8%. For a one-goal leader, those figures were 29.2% and 7.2%. Calling all of these outcomes “blown leads” conceals how often a setback still left a team with a point.
The pattern held at all four checkpoints. Two-goal leaders won about 88% of the time through minute 30, 91% at halftime, 92% through minute 60 and 97% through minute 75. The chart gives the full win, draw and defeat counts, including teams three or more goals ahead.
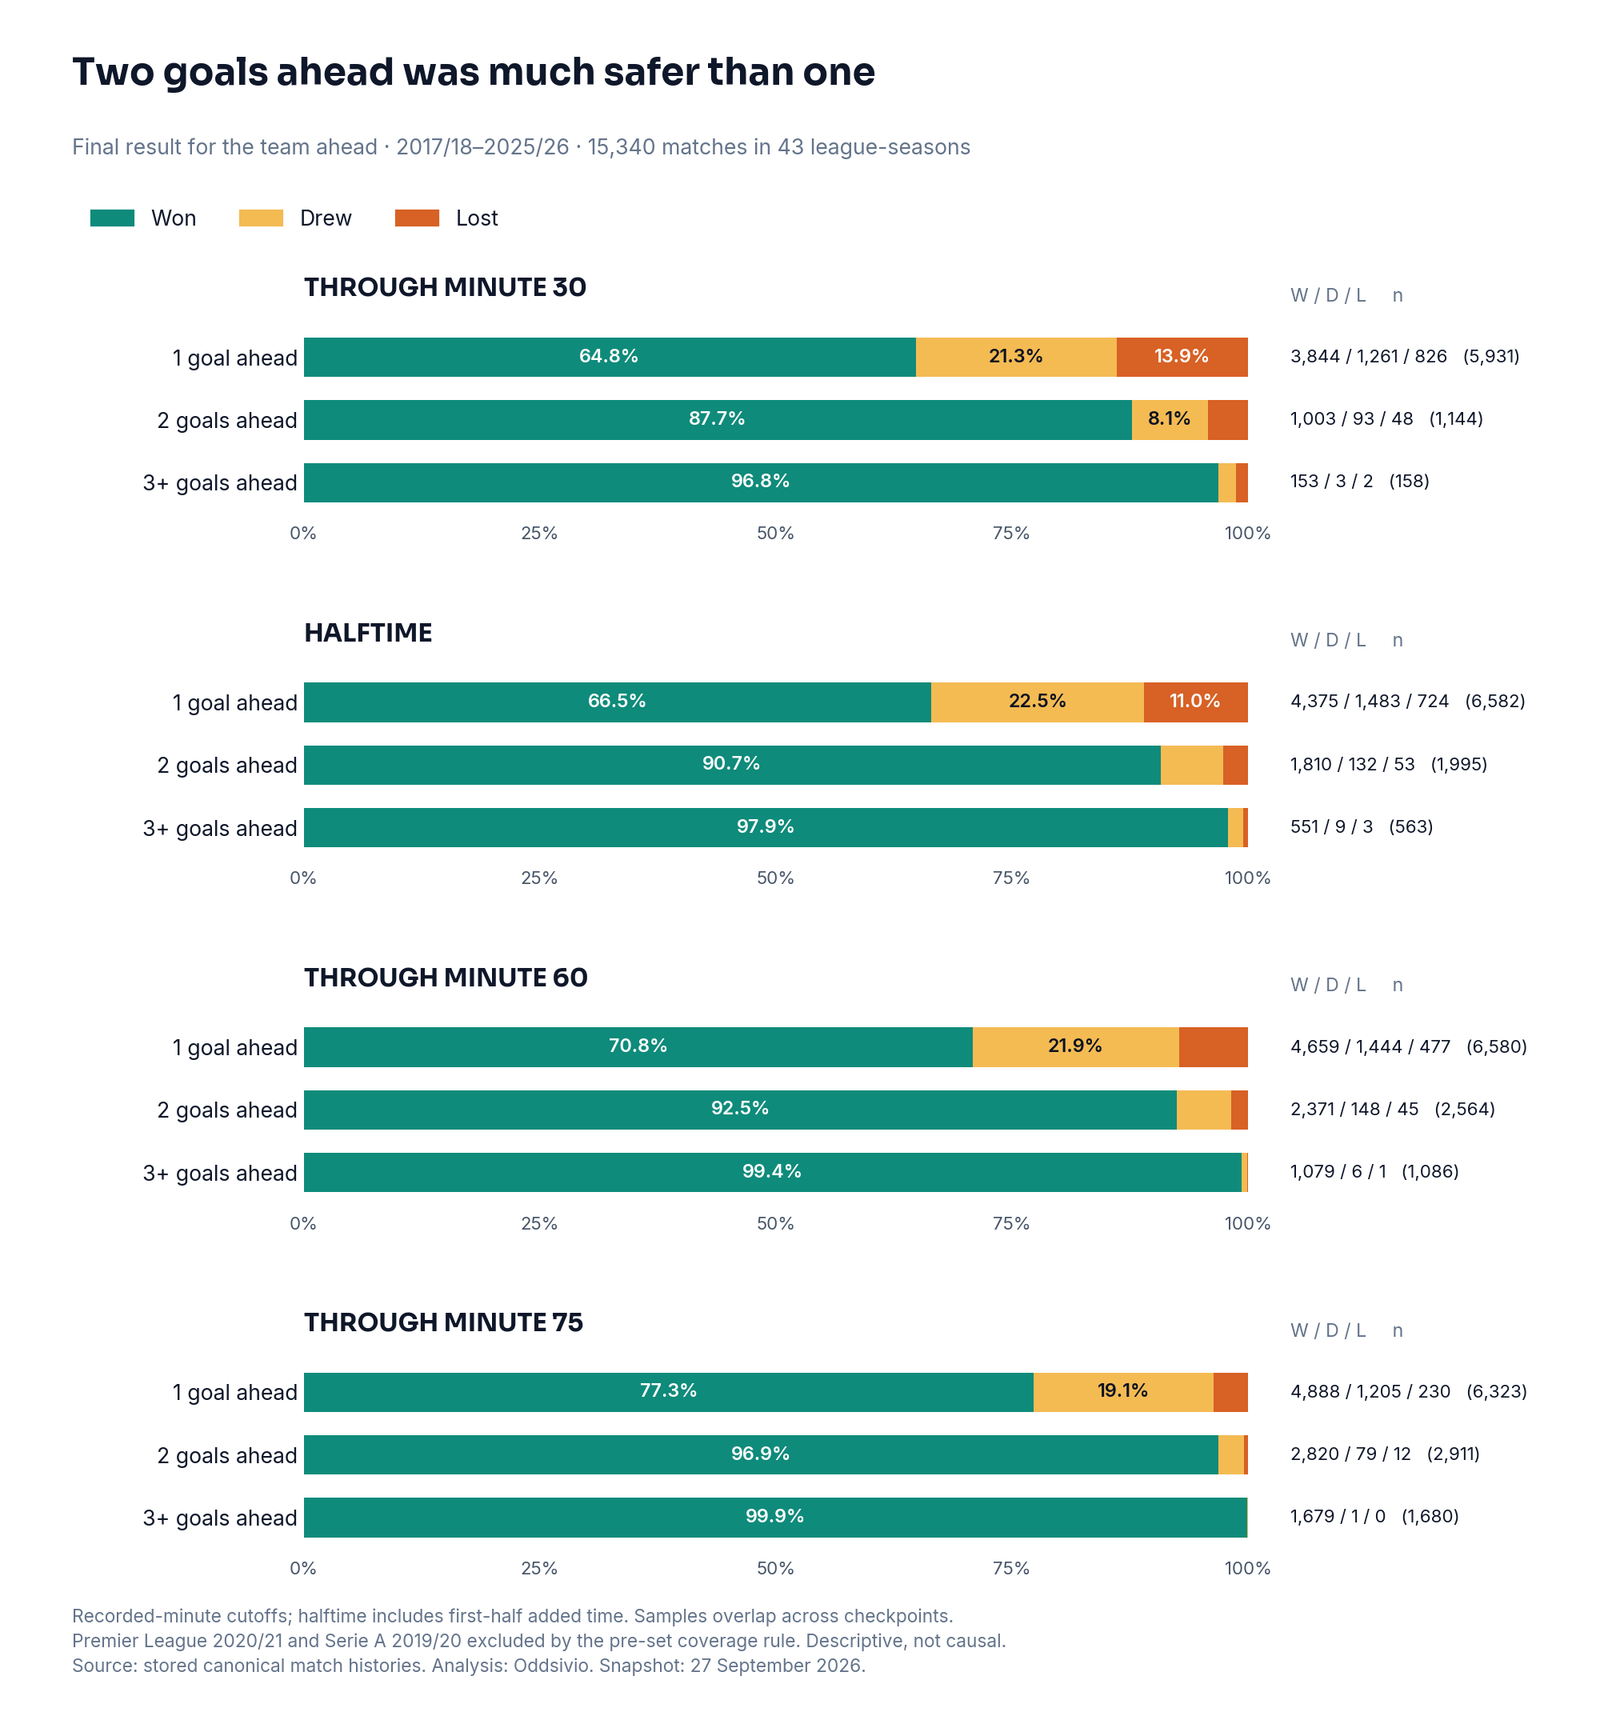
View chart at full size · Download checkpoint counts
For the literal 2–0 scoreline, including 0–2 away leads, the minute-60 result was almost identical: 1,938 wins, 125 draws and 32 defeats from 2,095 matches, a 92.5% win rate. The broader two-goal result is not being used as a substitute for checking the familiar saying. Exact 2–0 checkpoint results.
These are comparisons between different match states, not an experiment in which we give the same team an extra goal. They describe what happened; they do not measure the isolated causal value of scoring a second goal.
What happens after a team first goes 2–0 up?
We identified 6,144 matches with an unambiguous first 2–0 or 0–2 scoreline. Of those leaders:
- 5,500 were never equalised against after going two ahead.
- 120 were caught but recovered to win.
- 370 finished with a draw.
- 154 lost.
That is 644 teams caught, or 10.5%. But 120 of them still took all three points, leaving 524 non-wins, or 8.5%, and 154 defeats, or 2.5%. Overall, the team that first went 2–0 ahead won 91.5% of these matches.
Bayern's 4–3 win over Hertha in October 2020 illustrates the distinction. Bayern led 2–0, were pulled back to 2–2, and eventually won. Their two-goal lead disappeared; their chance of taking three points did not disappear with it.
Time makes a substantial difference to the observed frequency. Among teams first reaching 2–0 by recorded minute 30, 249 of 1,397 were later caught: 17.8%. When the second goal arrived from minute 76 onwards, 14 of 1,080 were caught: 1.3%. Even in that late-entry group, 14 leads were erased; low frequency did not mean zero.
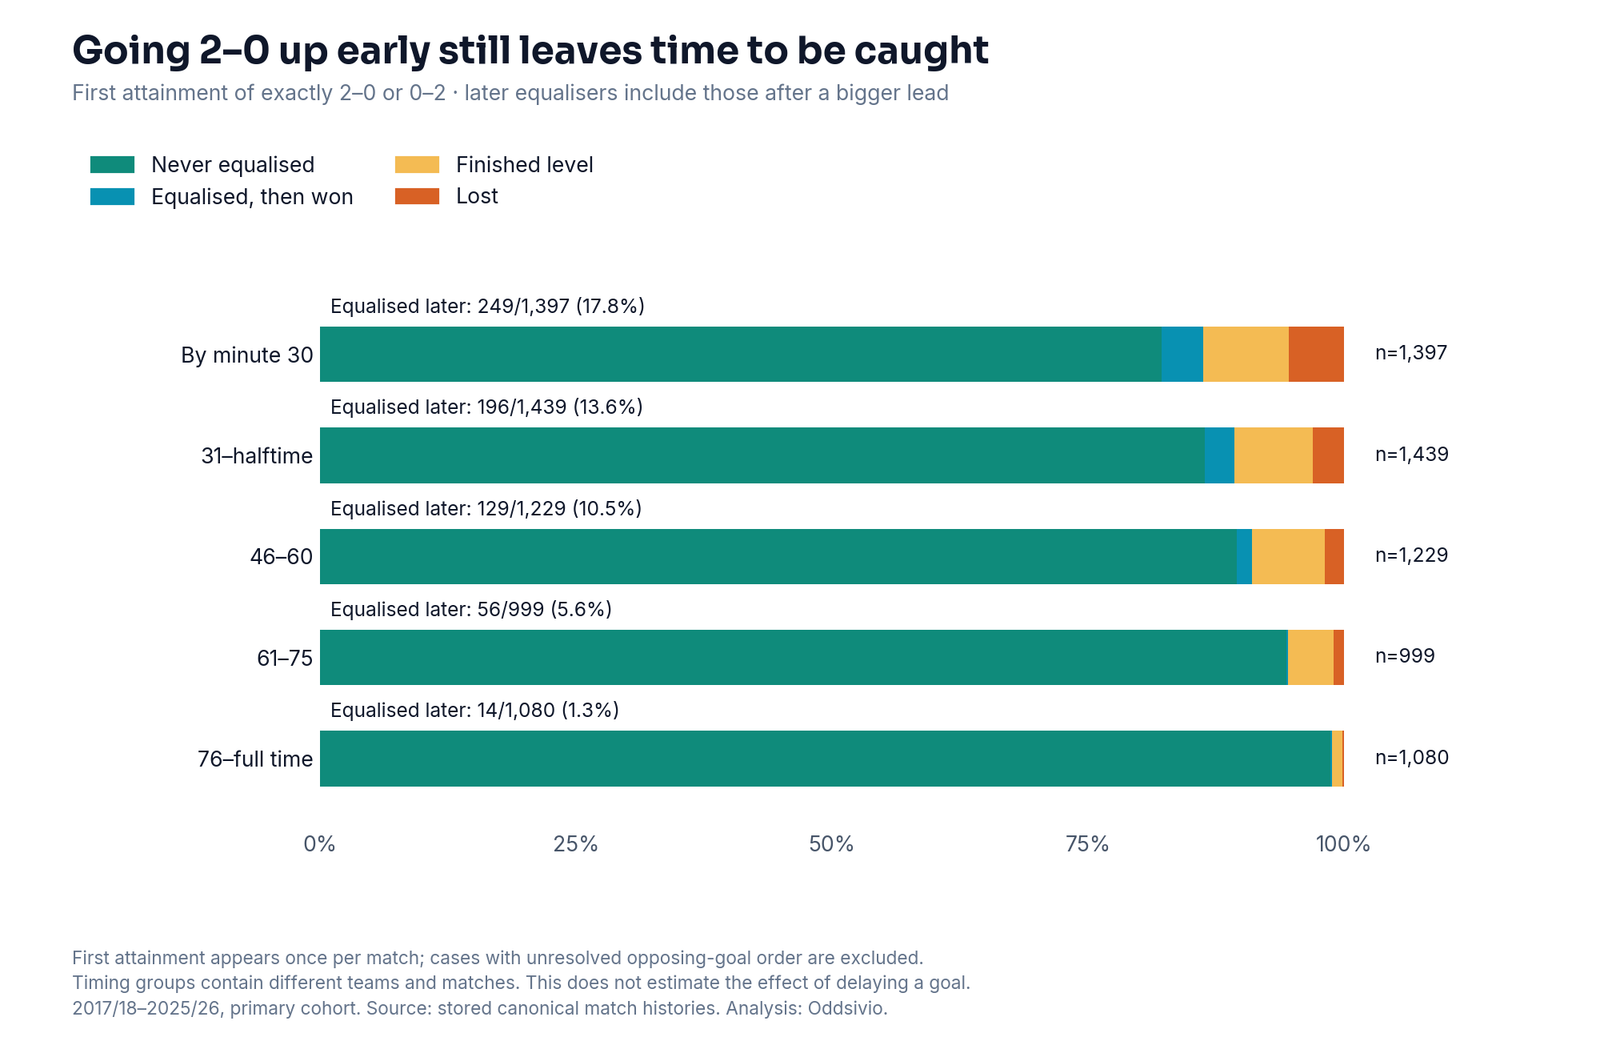
View chart at full size · Download first-attainment counts
For any first two-goal advantage, including 3–1 or 4–2, there were 7,387 team-leading episodes across 7,339 matches. We count each team's first such lead once; both teams managed it in 48 matches. Of these episodes, 705 were subsequently equalised, 126 ended in a recovered win, 411 in a draw and 168 in defeat. Full attainment totals.
Does the finding survive more seasons and leagues?
Yes, as a descriptive pattern. Through minute 60, the two-goal win rate exceeded the one-goal rate in each of the nine seasons and each of the five leagues in the retained data. The annual two-goal win rates ranged from 90.2% to 95.5%; one-goal rates ranged from 68.3% to 73.3%. This is no longer a conclusion resting on 2017/18 alone.
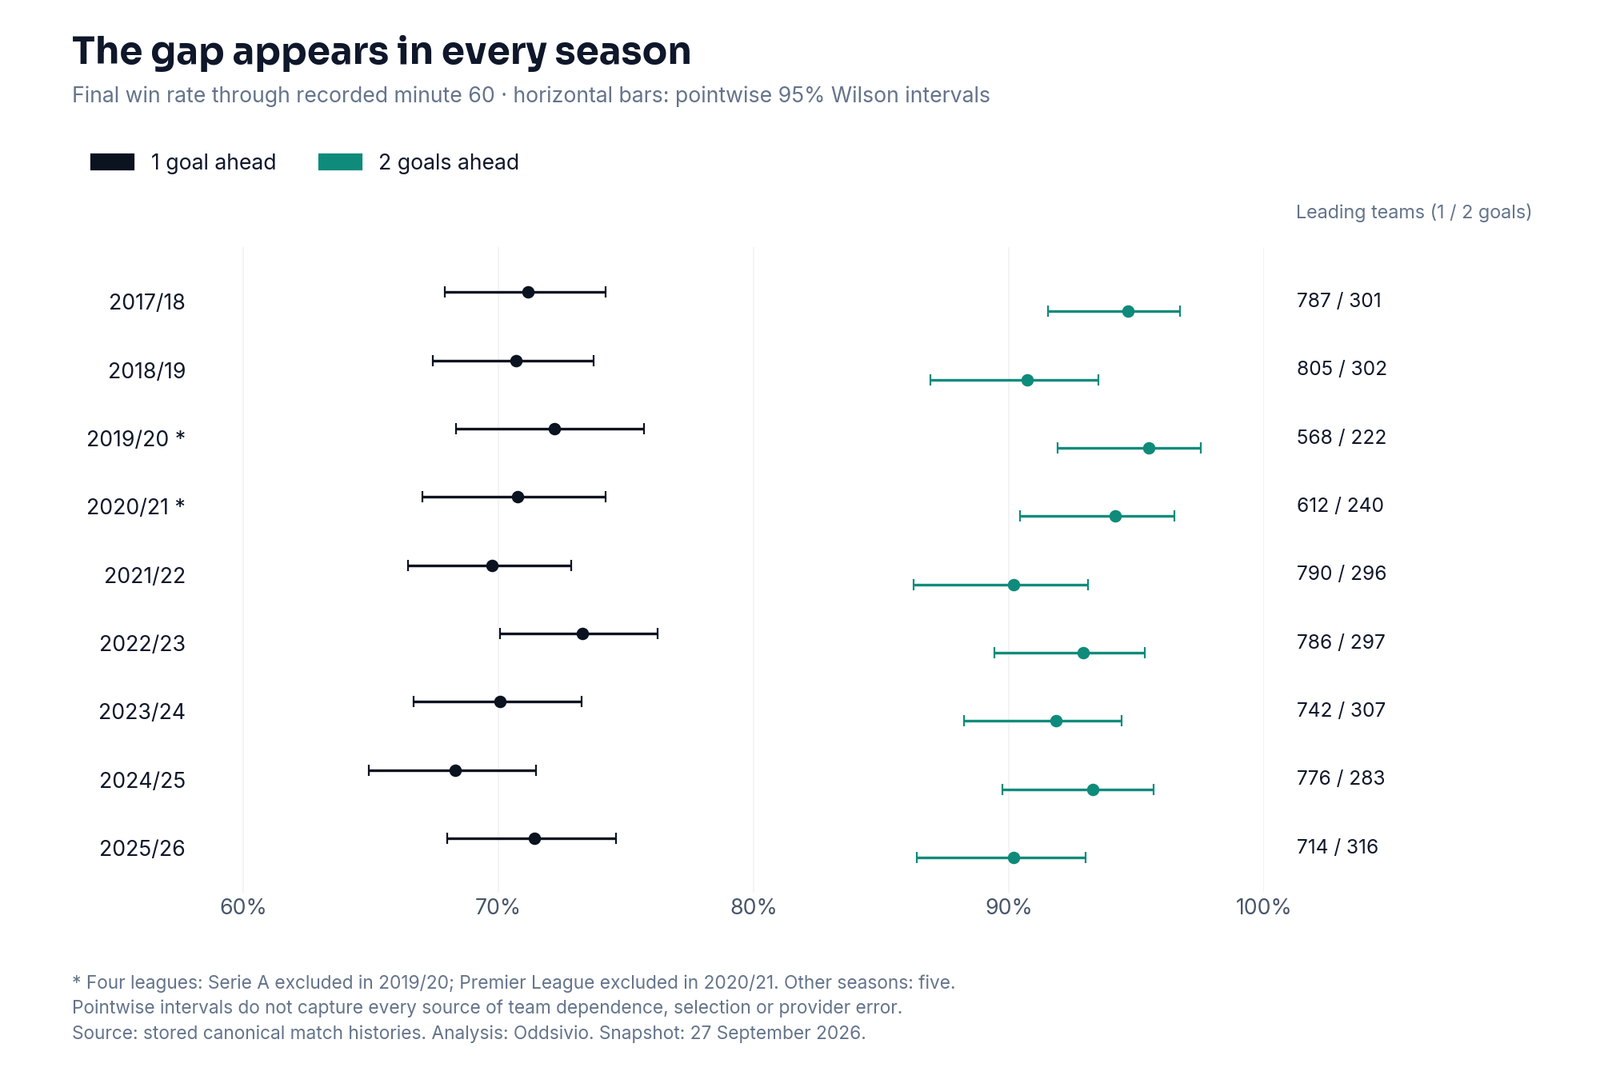
View chart at full size · Download season counts
Recent football gives the same broad answer. In 2023/24–2025/26, two-goal leaders through minute 60 won 91.7% of the time, versus 69.9% for one-goal leaders. In the latest two seasons alone, the comparison was 91.7% versus 69.8%. These are separate recent-period checks, not proof that the exact rates are constant. Era counts and league counts.
We also reran the comparison with all 16,078 individually usable matches, including the two excluded league-seasons; without the pandemic-affected 2019/20 and 2020/21 seasons; just before each recorded minute boundary; and after omitting matches with a goal on the boundary. Together with the latest-two-season check above, the minute-60 two-goal win rate stayed between 91.7% and 92.5% across these checks, and the one-goal rate between 69.8% and 70.9%. Sensitivity results.
The first-2–0 result is not perfectly fixed either. Including all usable matches produced a 10.5% later-equaliser rate; excluding the two pandemic seasons gave 11.0%; the latest two seasons gave 11.6%. Those variations matter more than treating the pooled 10.5% as a universal football constant. Attainment sensitivity results.
The scoreboard still needs context
A 2–0 lead held by a strong home side is not interchangeable with one held by a weaker away side. Our historical strength comparison uses only results available before kickoff, with earlier seasons providing warmup information. It is a simple descriptive rating, not a validated live forecast.
Through minute 60, two-goal leaders rated clearly weaker than their opponent won 199 of 245 matches: 81.2%. Clearly stronger leaders won 1,111 of 1,151: 96.5%. With a one-goal lead, the corresponding rates were 54.5% and 80.5%. Two goals remained better than one within each of the weaker, similar and stronger groups, but the identity of the teams still mattered.
The rating includes a home adjustment, requires both teams to have at least ten earlier observed games, and leaves insufficient histories unknown. Changing its update speed or removing the home adjustment preserved the direction of the minute-60 comparisons. These broad groups cannot remove every difference between teams or matches. Strength counts and rating sensitivity.
Venue alone also showed a difference: two-goal home leaders through minute 60 won 93.8% of the time, compared with 90.5% for away leaders. This is an association, not an isolated home-advantage estimate. Home and away counts.
Red cards are a limit of this study. Only 4,416 primary-cohort matches passed the stricter dismissal-history checks, and that subset was heavily selected towards games with recorded dismissals. Missing totals were not treated as zero. A pooled “red card versus no red card” chart would therefore imply a fair comparison that these records cannot support. We publish the coverage diagnostic, but do not claim a general dismissal effect or an all-eleven-a-side result.
Why a concession study can reach a different-looking conclusion
Kent and Brandes' 2025 study in CHANCE asks about the time until a team's next concession, with adjustments for strength, venue and scoring environment. That is a different question from whether the opposition eventually equalises or wins.
At 2–0, the next goal conceded makes it 2–1. At 1–0, it makes it 1–1. A team can be more exposed to the next concession under a model and still be more likely to win from the larger lead. Our descriptive results neither reproduce nor refute their hazard model, and neither establishes that complacency causes a collapse.
For a fan watching a match, the useful questions are therefore concrete: how much time remains, how strong are the teams, has the entire lead disappeared, and what was the final result? The label “dangerous” bundles those questions together.
What went into the study—and what remains uncertain
The underlying snapshot was taken on 27 September 2026, from Oddsivio's stored canonical match histories. We checked all 45 scheduled league-season sets for a complete home-and-away pairing of clubs. France's curtailed 2019/20 season had 279 played matches, confirmed in the LFP's board minutes; its 101 cancelled fixtures are not missing observations.
Of 16,111 played or officially ratified regular-season fixtures, three shortened matches and 30 further matches with unusable goal or score records, including administrative awards, were excluded, leaving 16,078 individually usable matches. The primary rule, fixed before this expanded outcome calculation, required at least 99% usable goal histories within each league-season after known shortened fixtures were removed. Premier League 2020/21 passed only 372 of 380; Serie A 2019/20 passed 366 of 380. Removing those two groups' 738 otherwise usable matches leaves the main 15,340. Full coverage ledger.
Play-offs, the additional Italian relegation tiebreak, administrative score awards and known permanently shortened games are outside the analysis. Goals must reconcile with both halftime and final scores. Disallowed goals and missed penalties do not count. Where opposing goals share an unresolved timestamp, the known checkpoint score can still be used, but the match is excluded from sequence analysis: this affects 28 primary-cohort matches. Three apparent duplicate stoppage-time braces were retained only after official reports confirmed separate goals; their missing clock detail was not invented.
Three known games resumed on later dates—Granada–Athletic, Udinese–Roma and Fiorentina–Inter—retain their joined goal histories for descriptive final outcomes. Excluding them is a separate sensitivity check. They are excluded from strength comparisons and rating updates, avoiding ambiguity about when their results became known. The interruption checklist is verified but cannot be claimed exhaustive.
An independent calculation from the frozen raw records checks the result counts and rating histories. A separate check against the open Wyscout/Pappalardo dataset matched all 1,826 final scores for 2017/18. On the 1,817-match common quality subset, minute-aligned checkpoint scores agreed in all cases at halftime and minute 60, and in 1,813 at minutes 30 and 75. That supports the reconstruction while also showing why different clocks and sources need explicit treatment. The feeds are not established as independent, and this one-season comparison does not validate later seasons.
The larger dataset is not a fully public raw-data release. Per-event provider labels are absent in the stored extract, so collection changes across seasons cannot be ruled out; the repository's legacy source convention does not establish independent provenance for every row. Internal reconciliation and selected official-report checks cannot guarantee that every event is perfect. Coverage exclusions may also select particular match types, even though the declared sensitivity checks leave the main pattern intact.
The chart intervals are pointwise 95% Wilson intervals. Repeated teams and overlapping checkpoints mean they do not capture all dependence or data-quality uncertainty. Season-by-season results and whole-season resampling are additional stability checks; nine season blocks are still a limited basis for broader inference. No causal model was fitted and no financial return was estimated, and the findings should not be extended automatically to cups, women's football, other leagues or future seasons.
We provide methods and definitions, the source audit, all aggregate results and a methods, code and aggregate-evidence download. The underlying multi-season provider records remain private; access to those histories is required for full record-level reproduction. The separate open 2017/18 benchmark remains available within the evidence package.
The football conclusion is clear within this coverage: two goals ahead was substantially safer than one at the same recorded match times. A lead can still vanish, especially when much of the match remains, but conceding, being equalised against and losing are not interchangeable outcomes.