How to read Match Insights: a step-by-step guide to Oddsivio's predictions
Every match on Oddsivio carries a Match Insights tab — the model's forecast, per-market calls on goals, cards and corners, and the transparent statistics behind them. Here's how to read all of it, and where we keep the receipts.
Every match page on Oddsivio has a tab called Match Insights. Behind it sits everything our prediction engine knows about that game: the most likely result and how confident we are in it, per-market forecasts on goals, cards and corners, and the raw statistics both are built from.
This guide walks through the whole thing once, slowly — from finding a match to checking our track record. We use one real game throughout: Excelsior vs PSV Eindhoven in the Eredivisie, screenshotted two days before kickoff on 13 August 2026, exactly as any visitor saw it.
One thing before we start, because it shapes everything you're about to see: Oddsivio does not publish betting tips. No "banker of the day", no "sure wins". What we publish are probabilities with evidence attached — and a public record of every forecast we've made, including the ones we got wrong. If that framing sounds unusual for a football site with the word "odds" in its name, good. It's supposed to.
Step 1 — Find your match
Head to Matches. Today's games are grouped by competition, with live scores as they happen; the date strip up top browses any other day. Matches that have insights ready are marked with a small chart icon on the right of the row — that icon is a direct link to the Match Insights tab.
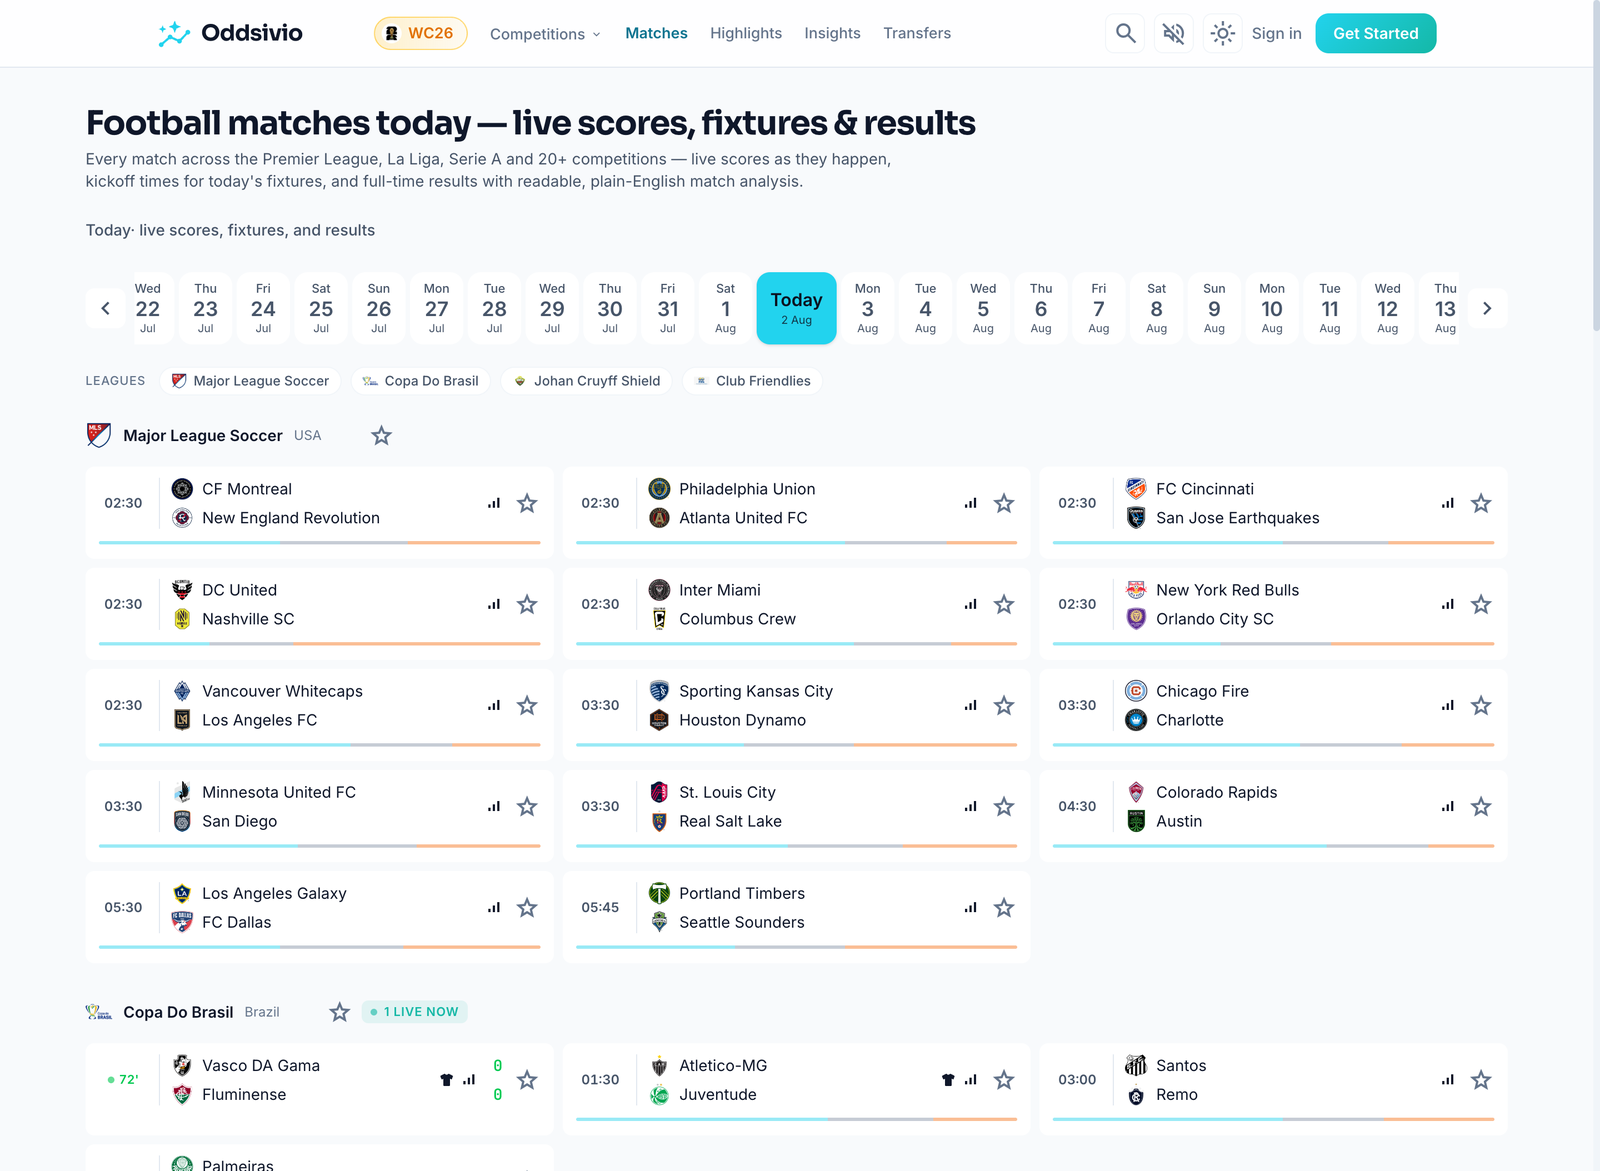
If you'd rather start from the forecasts and pick a game from there, the Predictions link in the top navigation takes you to a feed of every forecast we're publishing today — more on that page near the end of this guide.
Step 2 — Open the Match Insights tab
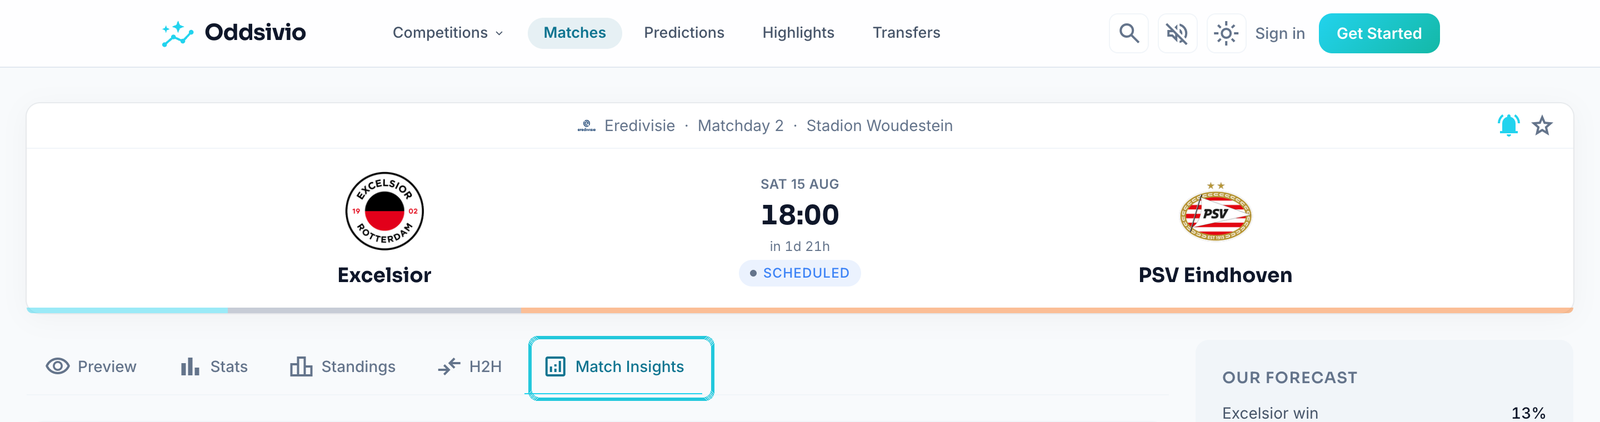
On an upcoming match page you'll find a row of tabs: Preview, Stats, Standings, H2H, Match Insights — with Overview and Videos joining them once the game kicks off. Click the one with the little analytics icon.
On a phone the tab row scrolls sideways — swipe it left and Match Insights is right there:
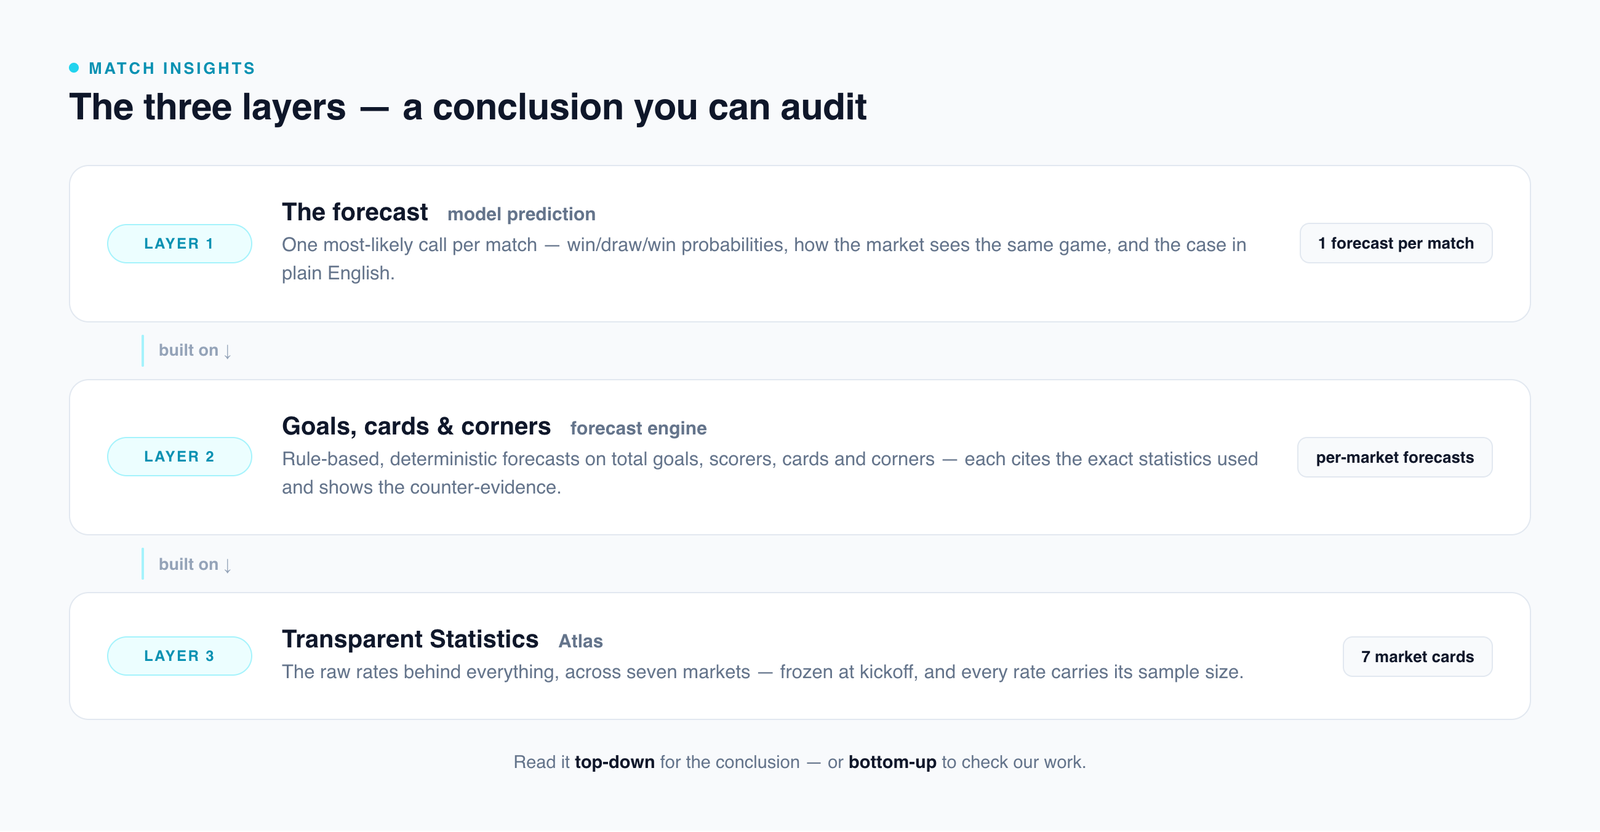
What you're about to read: three layers
The tab is organised top-down, from conclusion to raw material. Each layer is built strictly from the one below it — which means you can stop at the headline, or keep scrolling and audit every number that produced it.
Layer 1 — The forecast
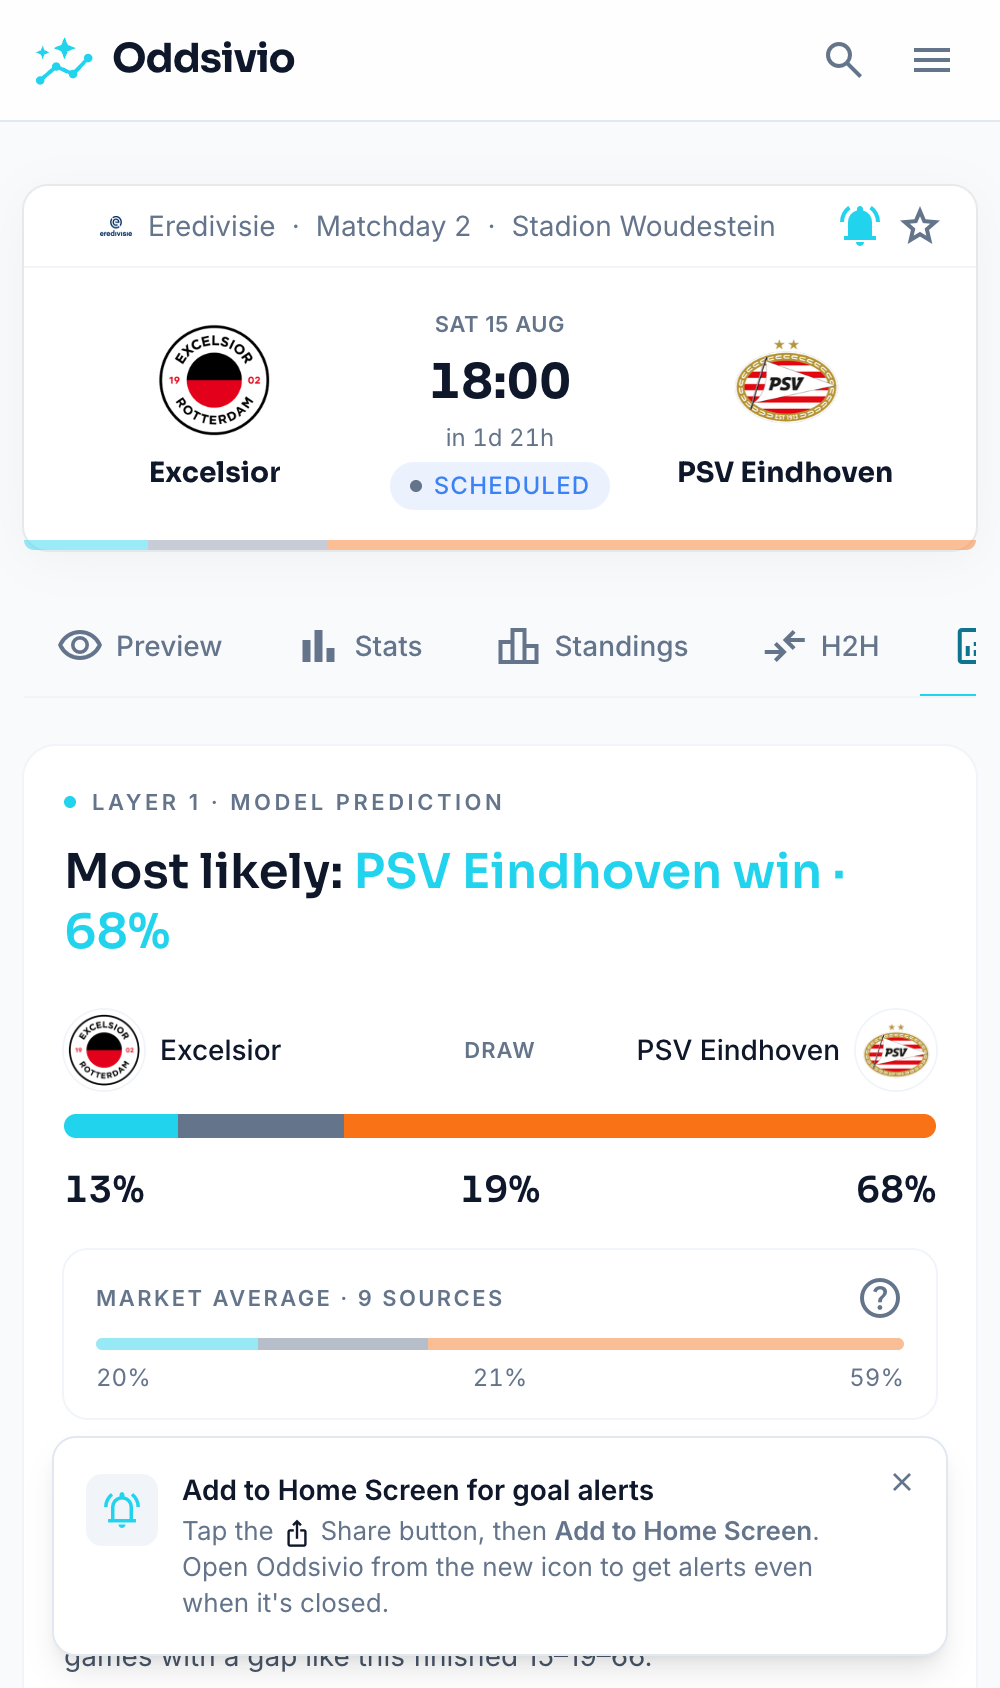
The first card is the model's read on the match, in one line: "Most likely: PSV Eindhoven win · 68%." Here's how to read the whole card:
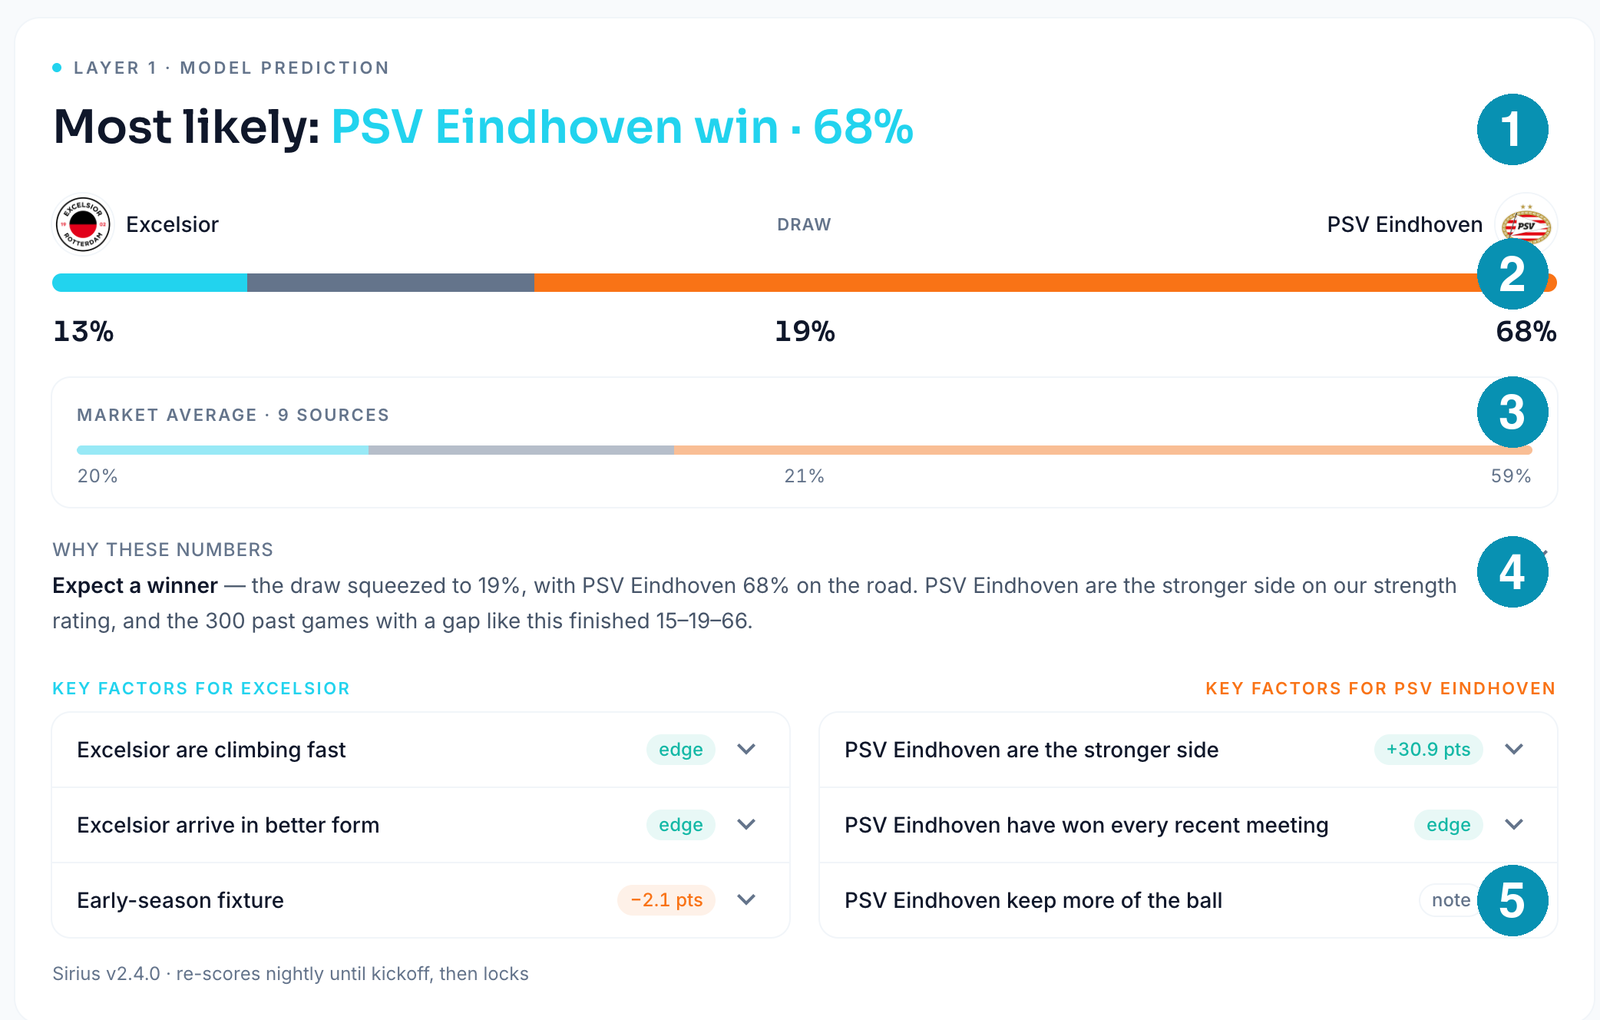
Five things worth knowing:
- The call (①) always names the most likely of the three results — home win, draw, or away win — with its probability attached, so a 68% read and a 41% read never dress alike. When the top two outcomes are nearly level you'll see a "Near coin-flip" chip instead of false confidence.
- The probabilities (②) are our model's, not the bookmakers'. In this example: Excelsior 13%, draw 19%, PSV Eindhoven 68%.
- The market average (③) shows how the bookmakers price the same game — here nine sources, averaging PSV at 59%. Comparing the two rows is the entire point of the card: the market broadly agrees, we lean a little harder. When we differ sharply from the market, that's exactly the kind of thing this card exists to make visible.
- Why these numbers (④) is the case in two or three sentences, with sample sizes — here, that PSV are the stronger side on our strength rating, and that the 300 past games with a gap like this finished 15–19–66. Expand it for the full reasoning.
- Key factors (⑤) list what moved the number for each side, each with its weight — strength rating, form, head-to-head, availability. Expand any of them for the underlying data. And when one side has nothing going for it, we say exactly that: "Nothing to weigh on this side."
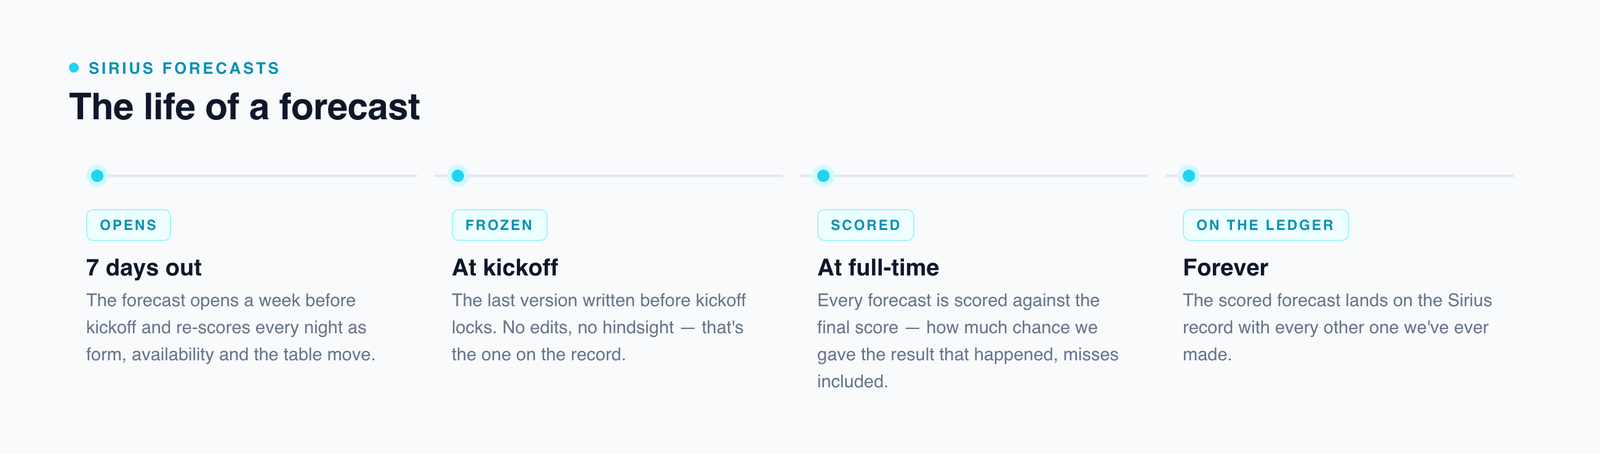
At the bottom of the card, note the small print: "re-scores nightly until kickoff, then locks." The forecast isn't a one-off hot take — it re-computes every night as evidence changes, and the last version written before kickoff is the one that goes on our permanent record. No edits after the fact, ever.
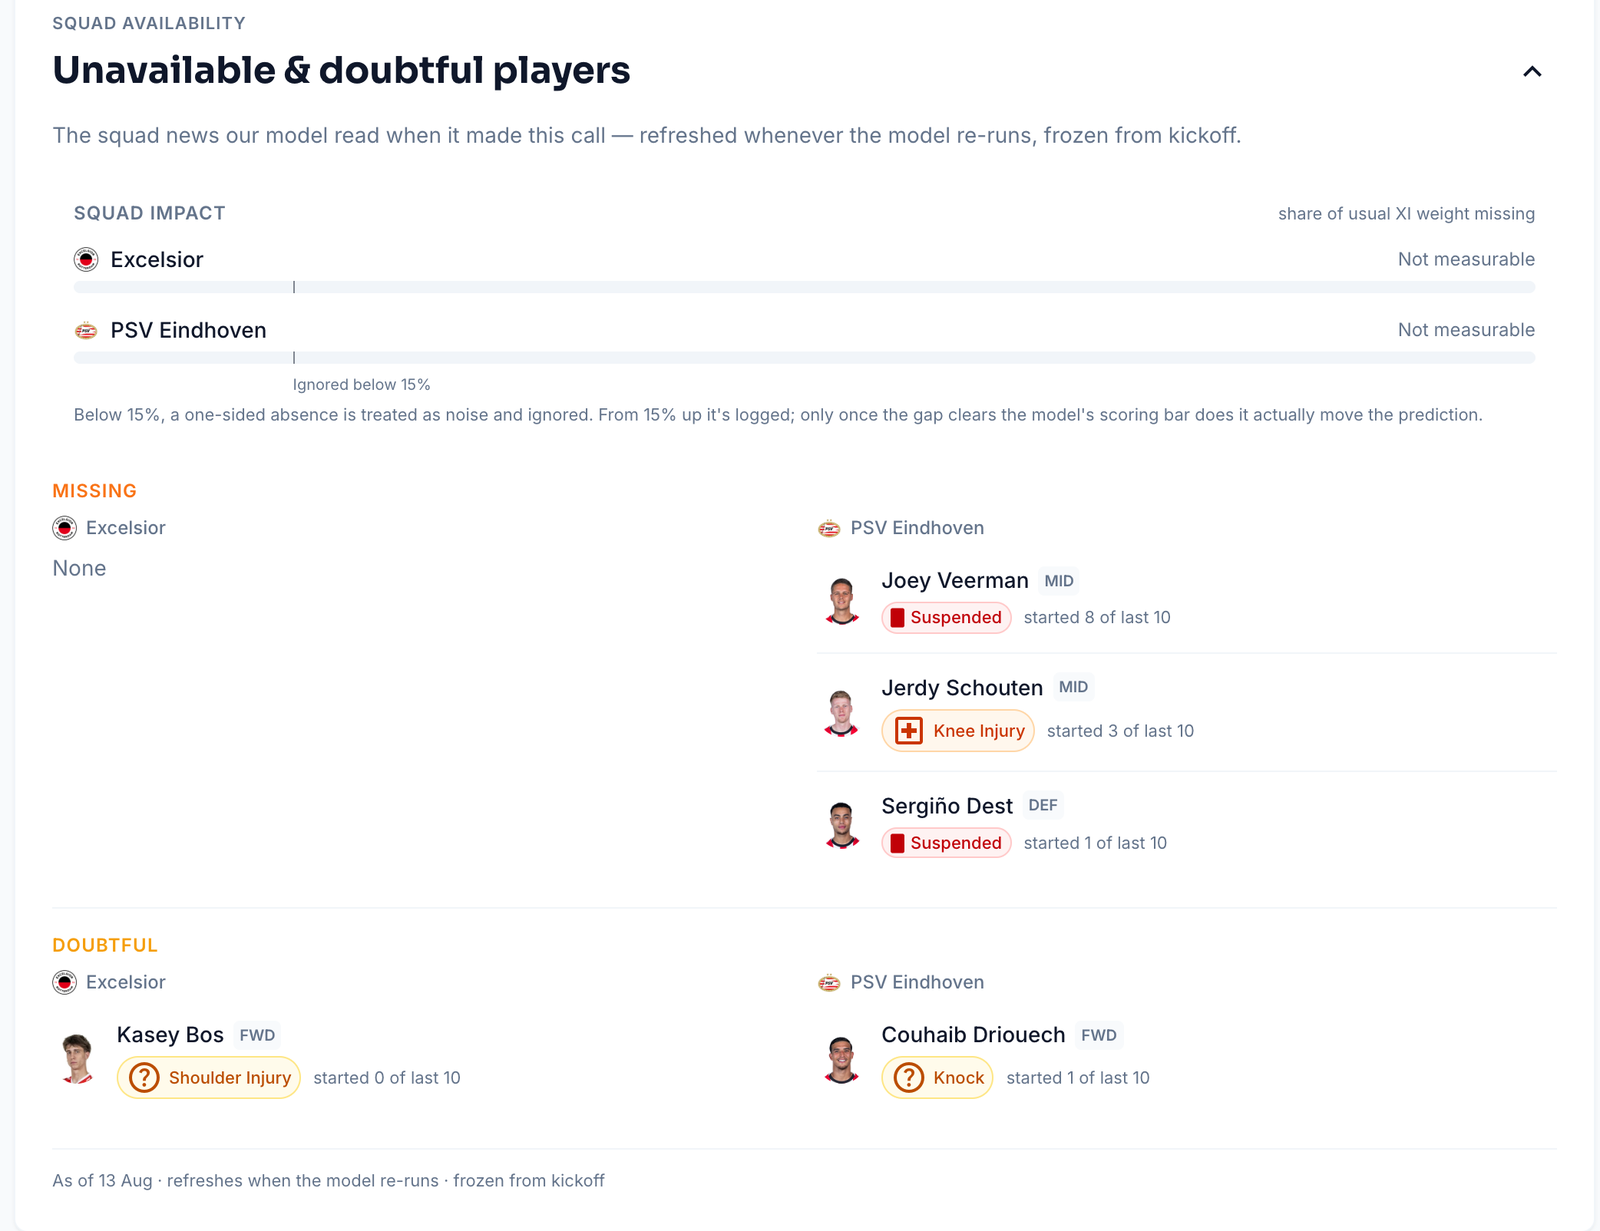
The squad news the model read
Right under the forecast sits Unavailable & doubtful players — not generic injury news, but the exact availability picture the model weighed when it made this call, with each side's missing share of usual line-up strength. Expand it to see every player, grouped into Missing and Doubtful — here, PSV without Joey Veerman, Jerdy Schouten and Sergiño Dest.
Layer 2 — Goals, cards & corners
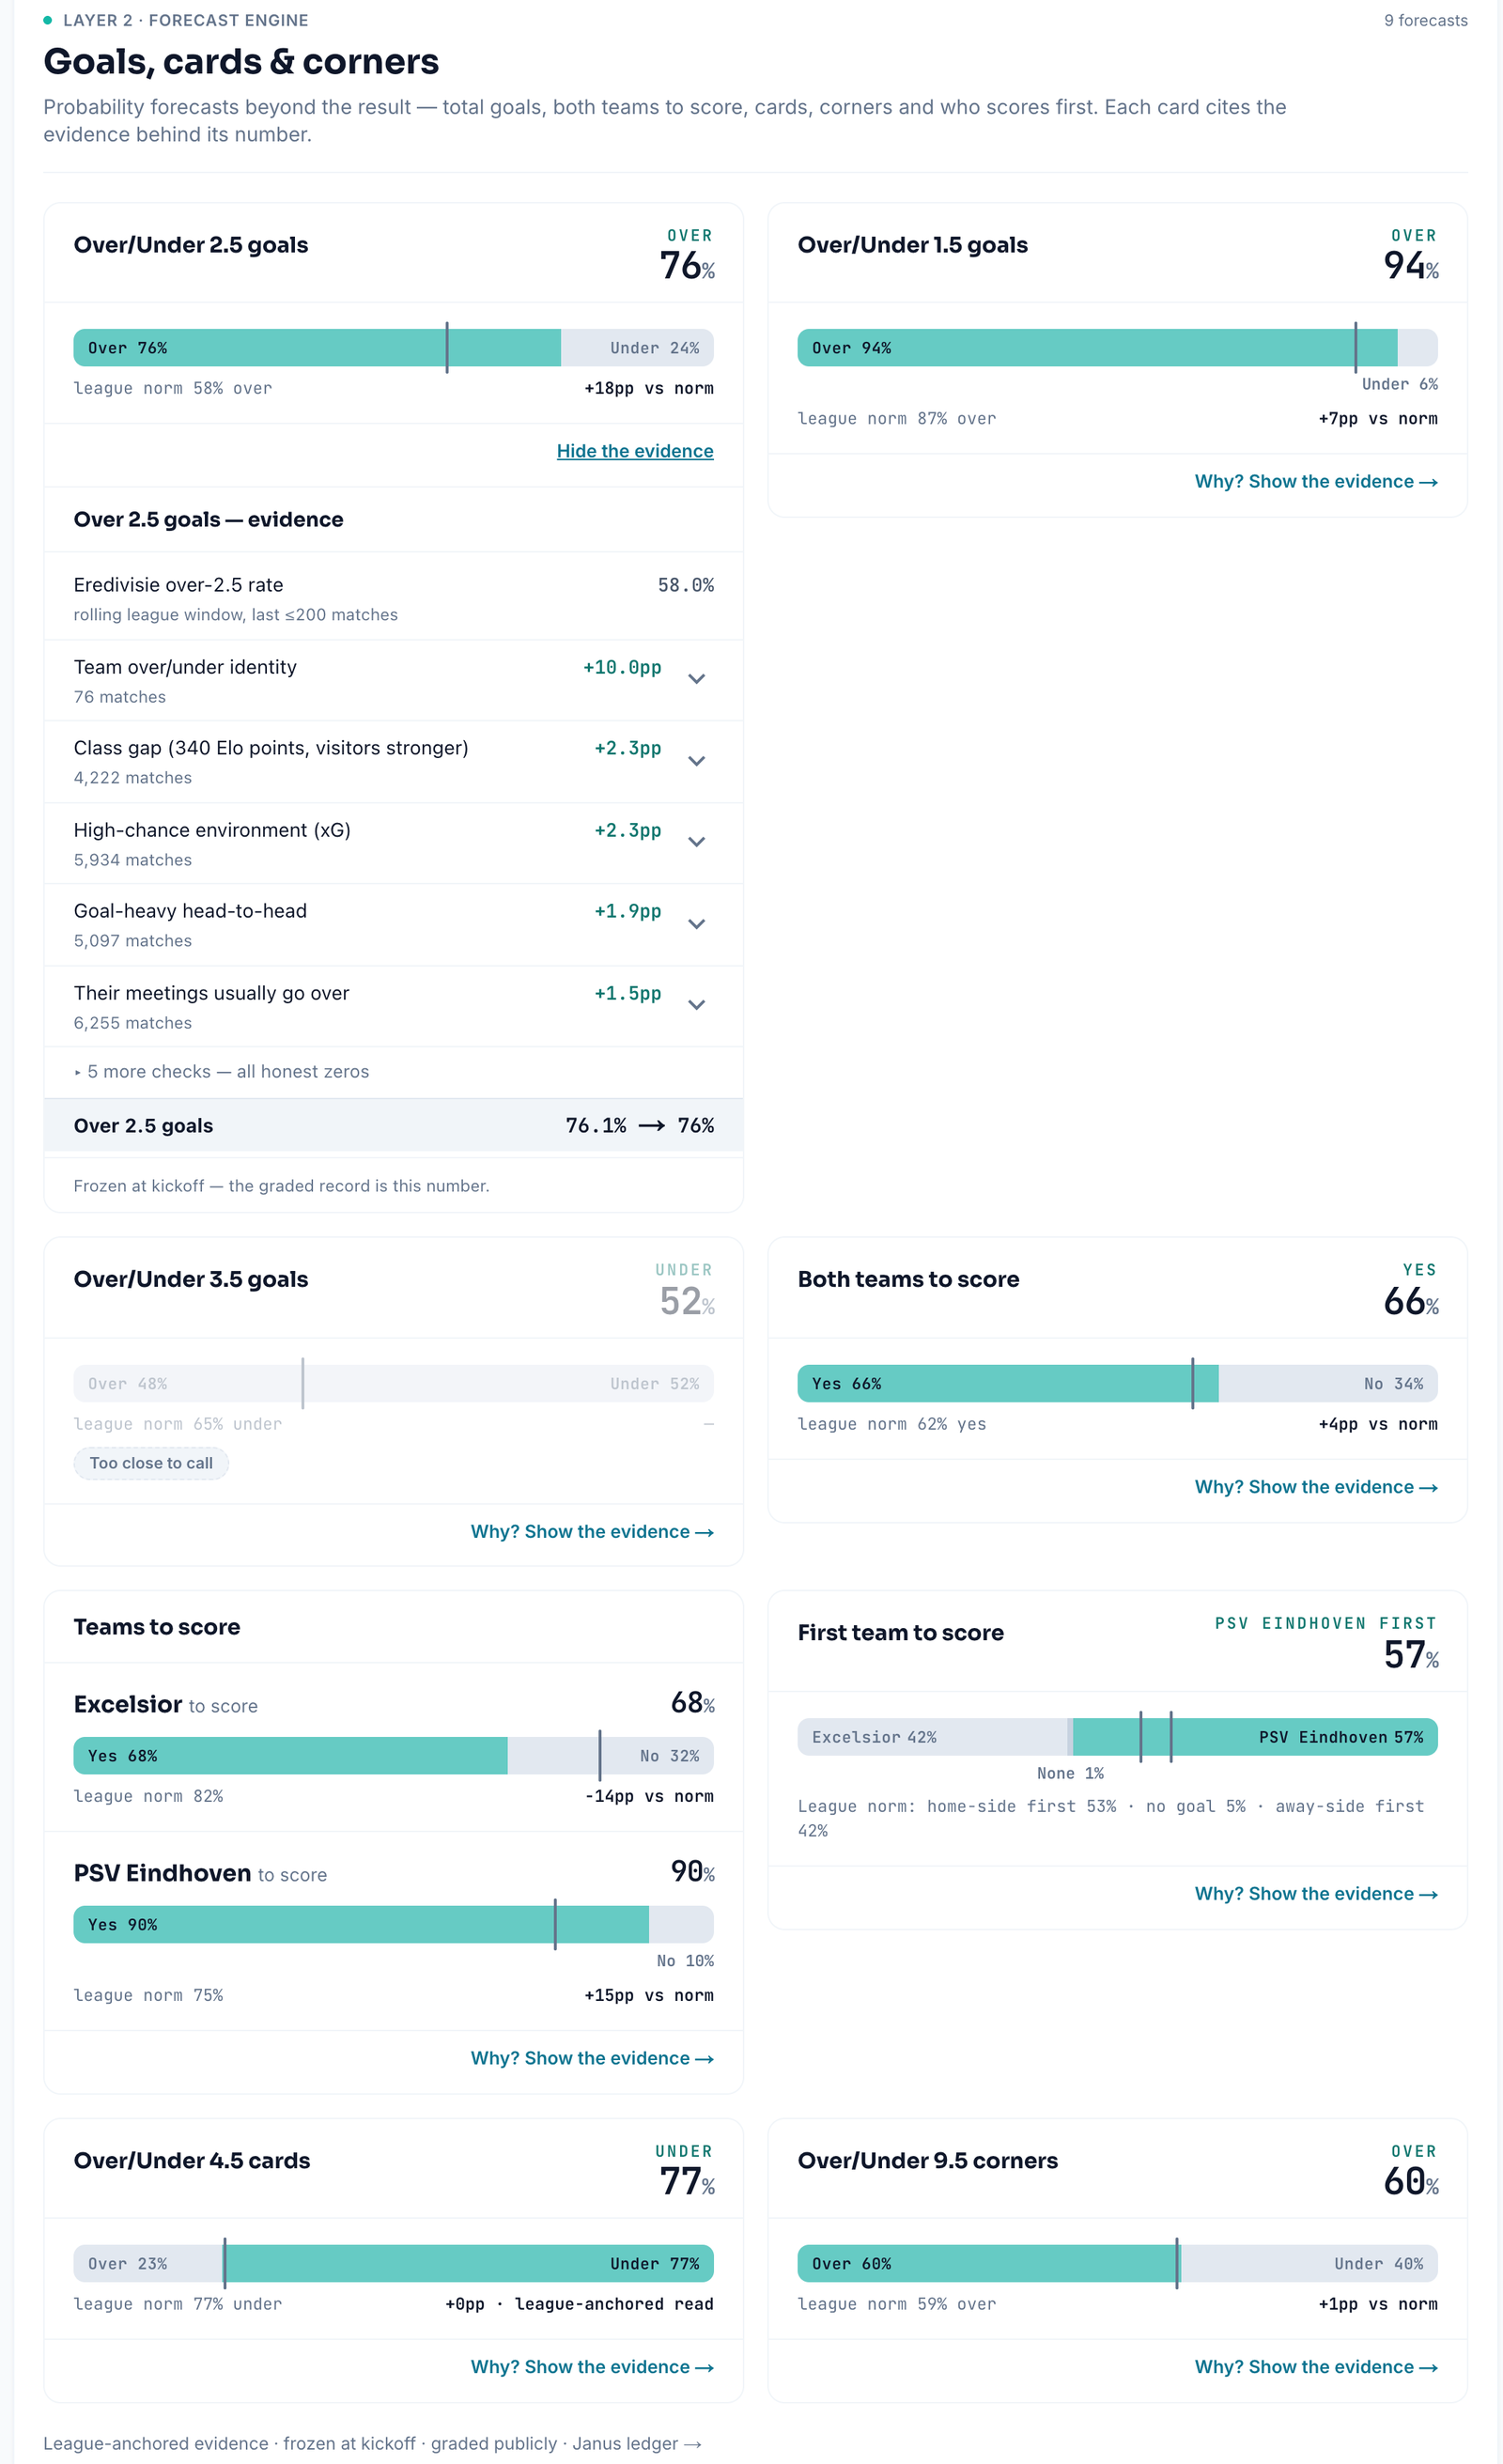
Scroll on and you reach the forecast engine. Where Layer 1 gives one read on the match result, Layer 2 covers the other questions fans actually ask: over/under goals at three lines, both teams to score, each team to score, first team to score, cards, corners — nine forecasts on this match, each stated as a probability against its league norm.
Three habits will serve you well here:
- Read the norm, not just the number. "Over 2.5 goals: 76%" sounds strong on its own. The card also tells you the league norm is 58% — so the real information is the +18 points versus norm, not the 76.
- Click "Why? Show the evidence." Every forecast here is rule-based and deterministic — no black box. The evidence panel cites the exact statistics that moved the number, with sample sizes; checks that found nothing are listed too ("all honest zeros"), and when something cuts the other way it appears under "Working against this". A forecast that hides its counter-evidence is an ad; ours are audits.
- Watch for the frozen line. Each evidence panel ends the same way: "Frozen at kickoff — the graded record is this number." And the section signs off with the standard we hold it to — league-anchored evidence, frozen at kickoff, graded publicly — linking straight to the Janus ledger, where every one of these forecasts is graded in public.
Layer 3 — Transparent Statistics
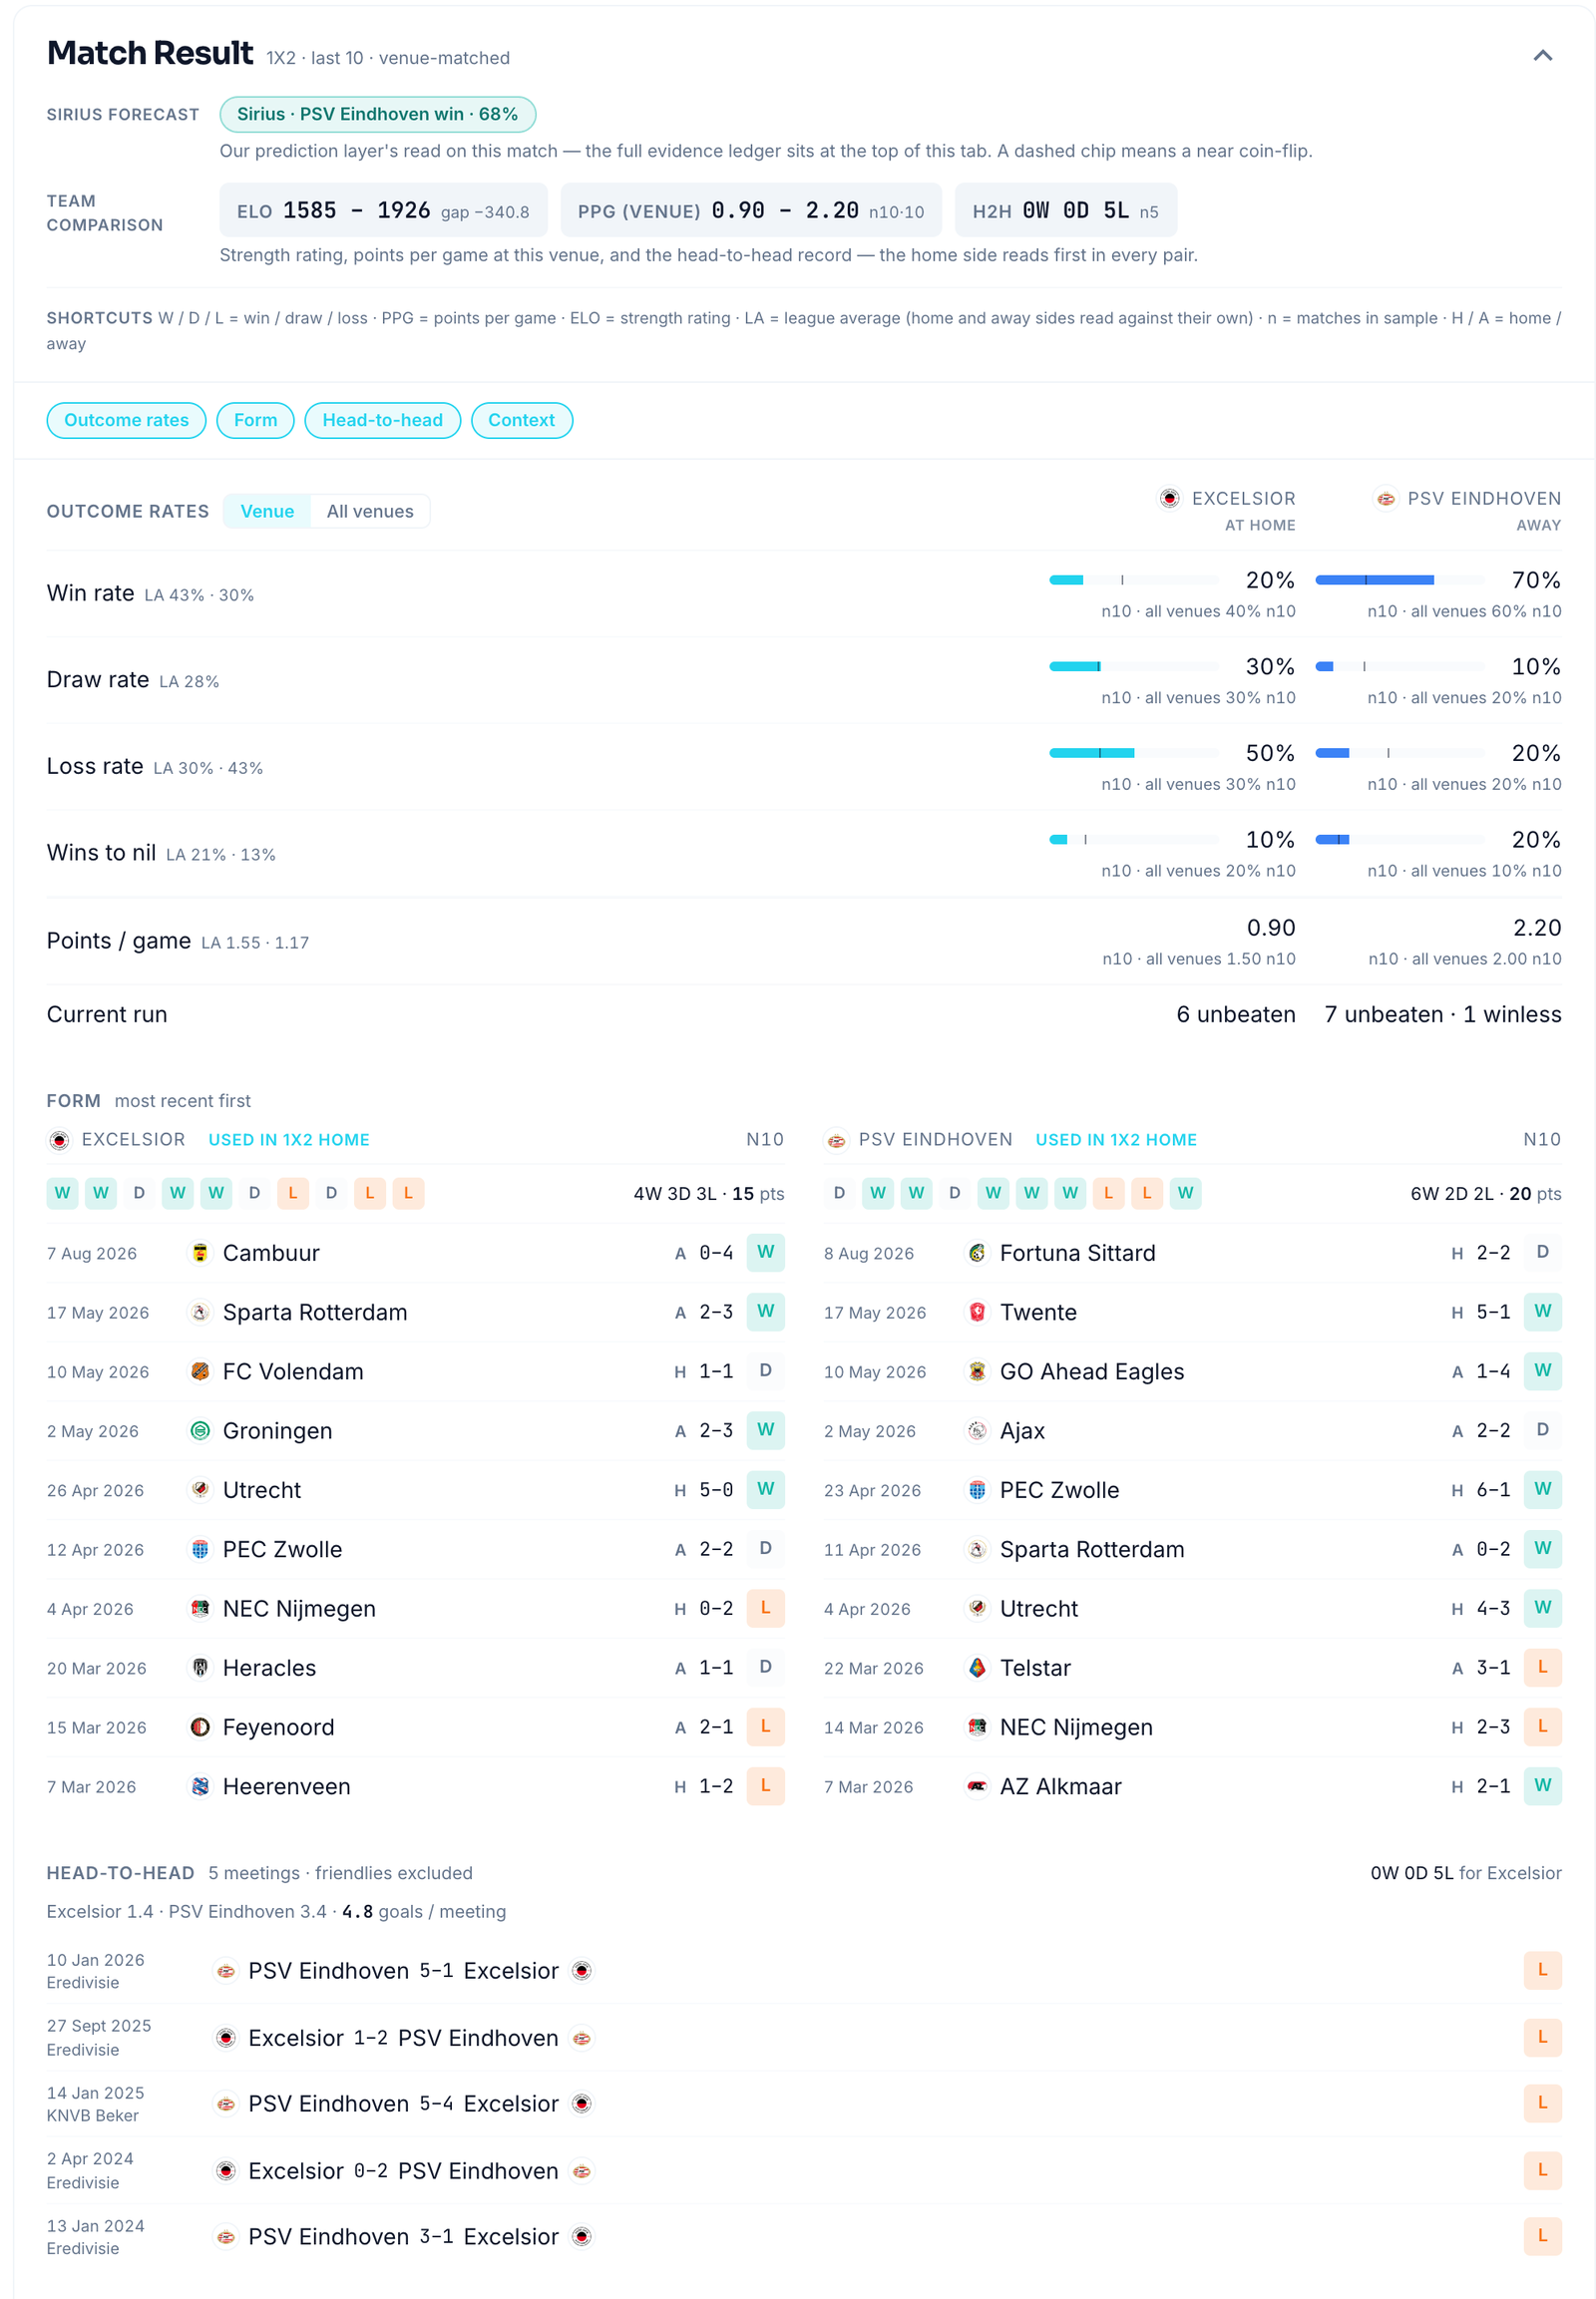
The bottom layer is the raw material: seven market cards — Match Result, Goals Over/Under, Both Teams to Score, Team to Score, First Team to Score, Cards, Corners — every one showing historical and seasonal data only, frozen at kickoff, with the sample size printed next to every rate.
Expand a card and it opens into a full dossier. Here's Match Result — outcome rates at this venue and overall, form, head-to-head, league position at kickoff, strength and rest:
All seven cards share the same anatomy, so once you can read one you can read them all. The Cards market, annotated:
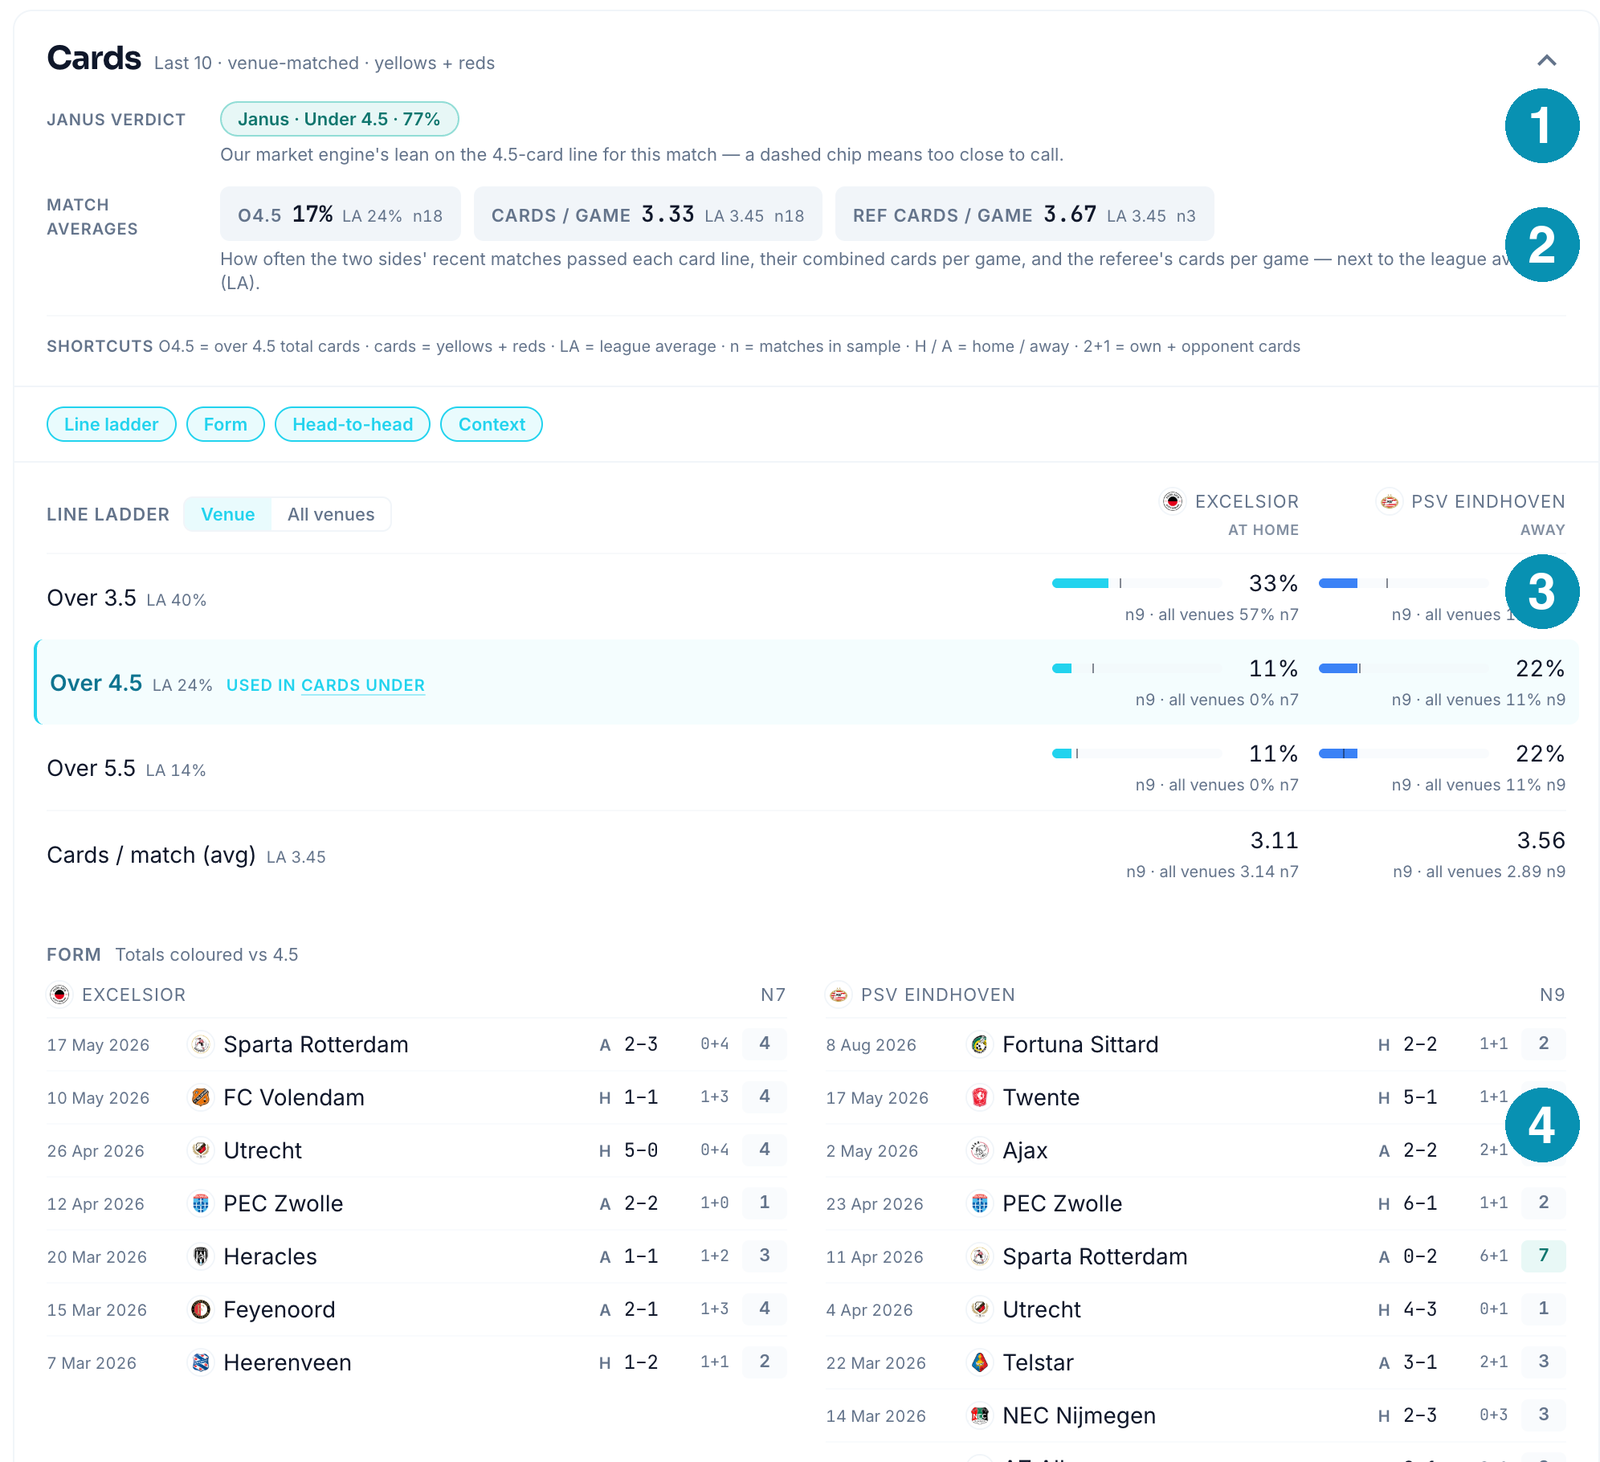
Two reading habits here:
- "LA" and "n" are your friends. Every rate sits next to the league average and the number of matches behind it. A 60% rate over ten matches against a 49% league average is information; a 60% rate over three matches is noise wearing a suit.
- The dashed chip means we're not pretending. When a chip is dashed, the numbers are genuinely too close to call — and the card says so instead of manufacturing a lean.
And at the very bottom of the tab, one sentence we mean literally:
These signals describe historical patterns in recent matches. They are not betting advice.
Also on the match page: the odds themselves
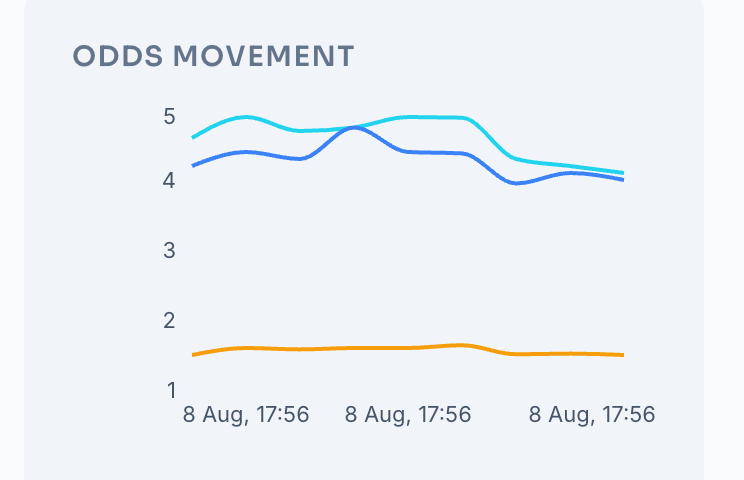
In the sidebar (below the tabs on mobile), two things are worth a look before kickoff. Our forecast repeats the Layer 1 probabilities in miniature so they stay visible as you scroll. And Odds Movement charts how the bookmaker prices for this fixture have drifted since we started tracking them — the market changing its mind in real time:
What happens to a forecast after you close the tab
This is the part most prediction sites don't have, so it deserves its own diagram:
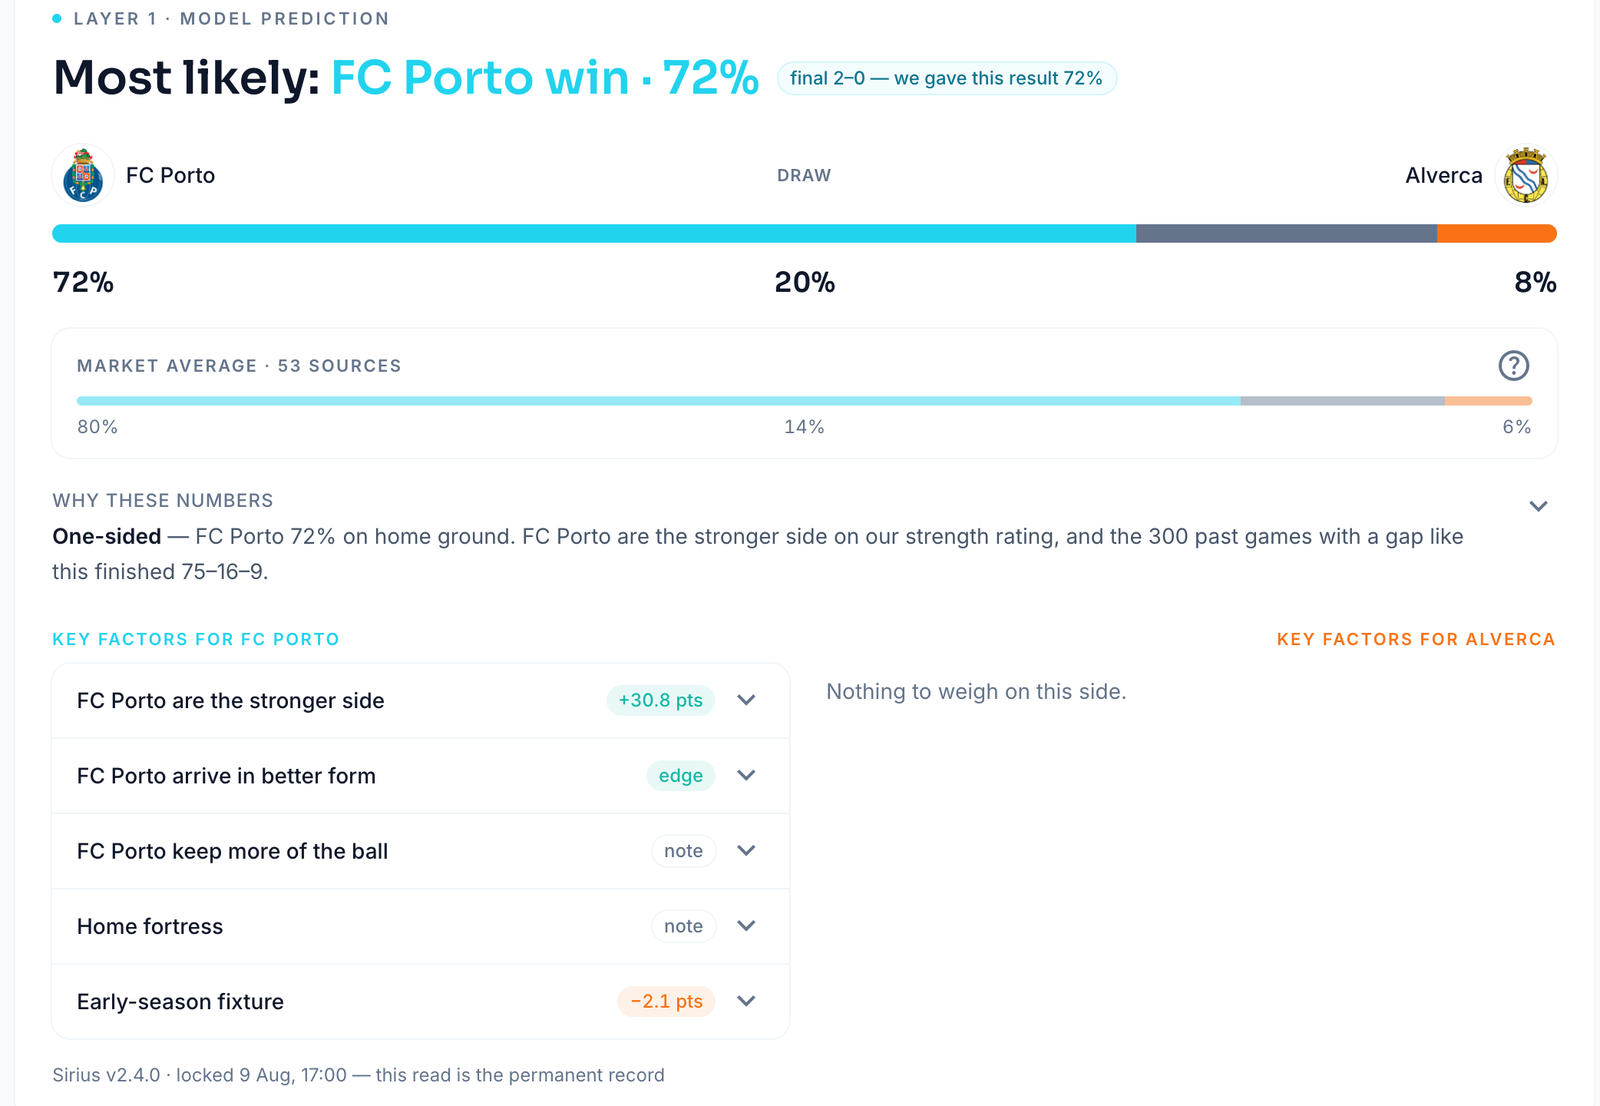
Come back to any match after full-time and the forecast card shows how it did, right in the headline — no burying. There's no green tick or red cross, because a probability isn't a promise: the chip simply states how much chance we gave the result that actually happened.
Why the tab is sometimes "empty" — and why that's the point
Open a match ten days out and you won't find a forecast. You'll find this:
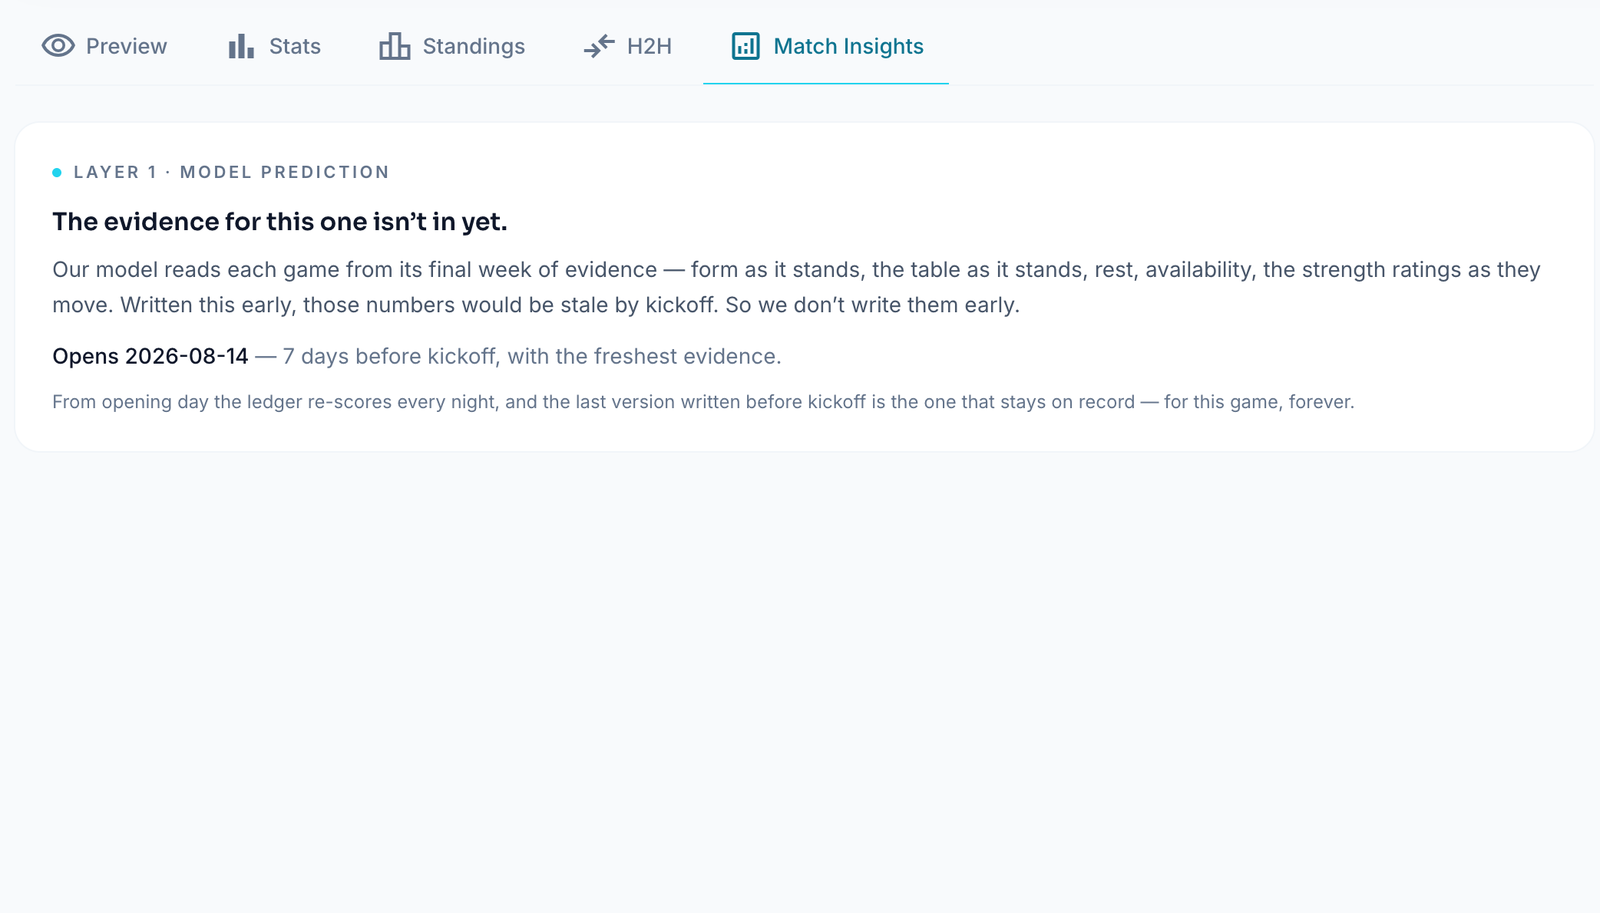
The model reads each game from its final week of evidence — form as it stands, the table as it stands, rest, availability. Written earlier than that, the numbers would be stale by kickoff. So we don't write them early, and the card tells you exactly when the forecast opens instead: seven days before kickoff, with the freshest evidence.
The same honesty applies elsewhere: friendlies and international fixtures don't get model output at all (the evidence base isn't comparable to league football), and when the model can't read a game — a newly promoted side with no track record, say — it sits the game out and says so. Those sit-outs are counted and published on the record like everything else.
The Predictions page: today's slate in one feed
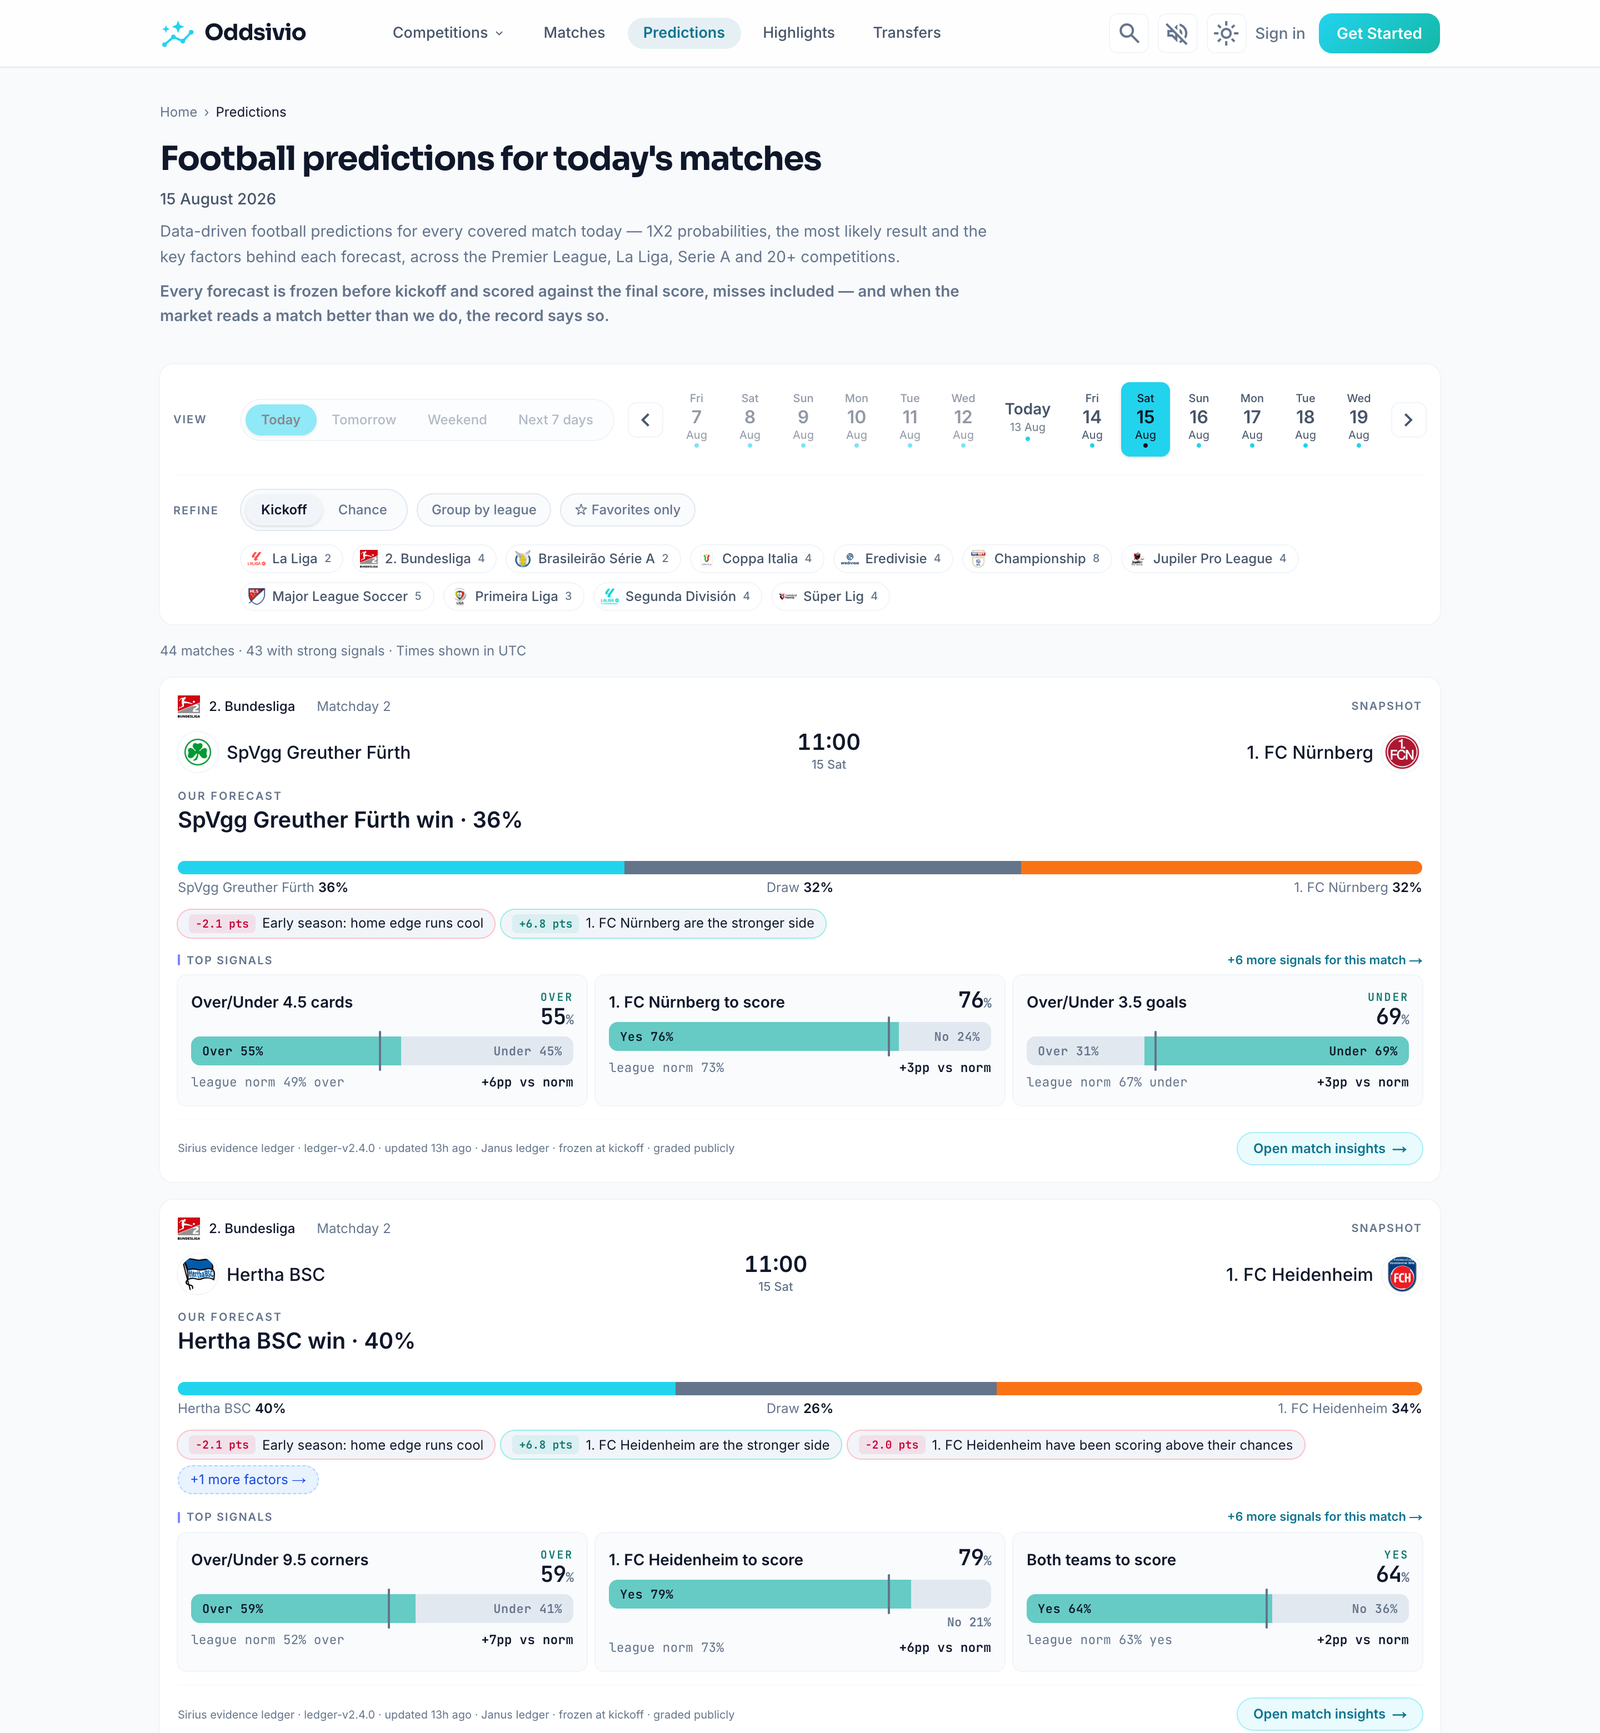
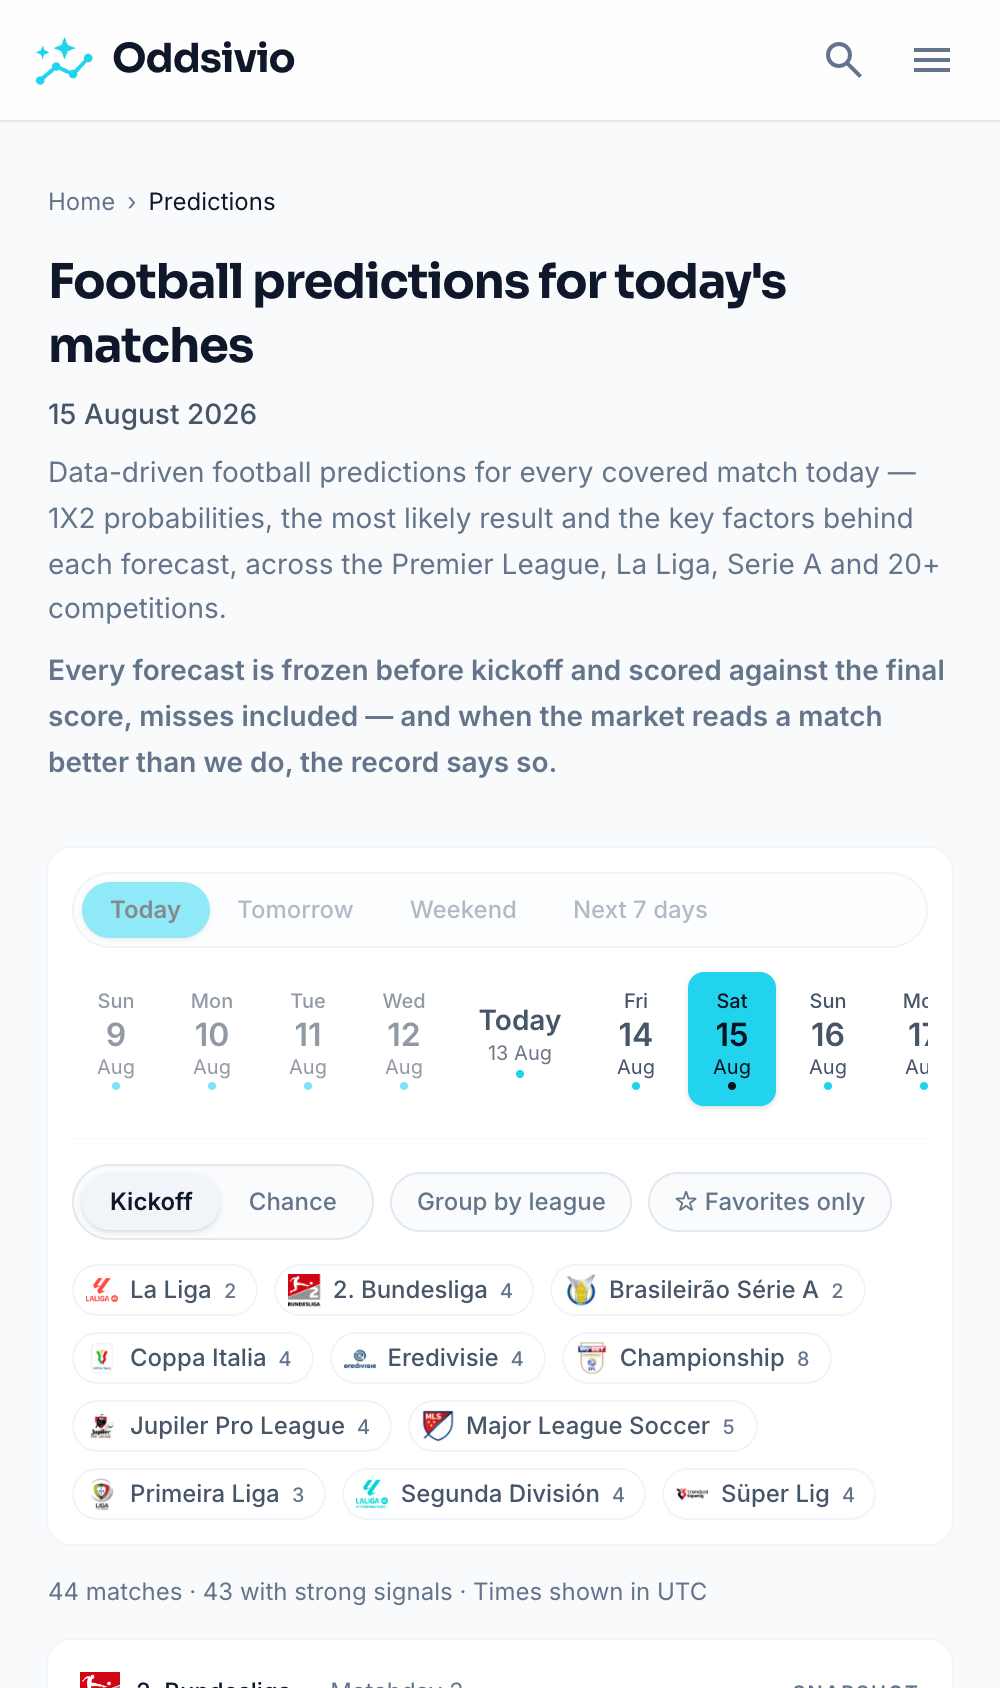
Everything above lives on individual match pages. The Predictions page — the same one linked in the top navigation — is the daily overview: every forecast for today's matches with its key factors and top per-market calls, sortable by kickoff or by chance, groupable by league, with a date strip for the days ahead.
Our receipts
Scroll to the bottom of the Predictions page and you'll find the two strips we're proudest of — not because the numbers are huge, but because they're real:

Note what the first strip says out loud: where the market consensus was saved before kickoff, it has been closer than us — and that line stays up until the data says otherwise. Publishing that sentence next to our own record is the difference between a track record and an ad. Anyone showing you only the wins is selling something.
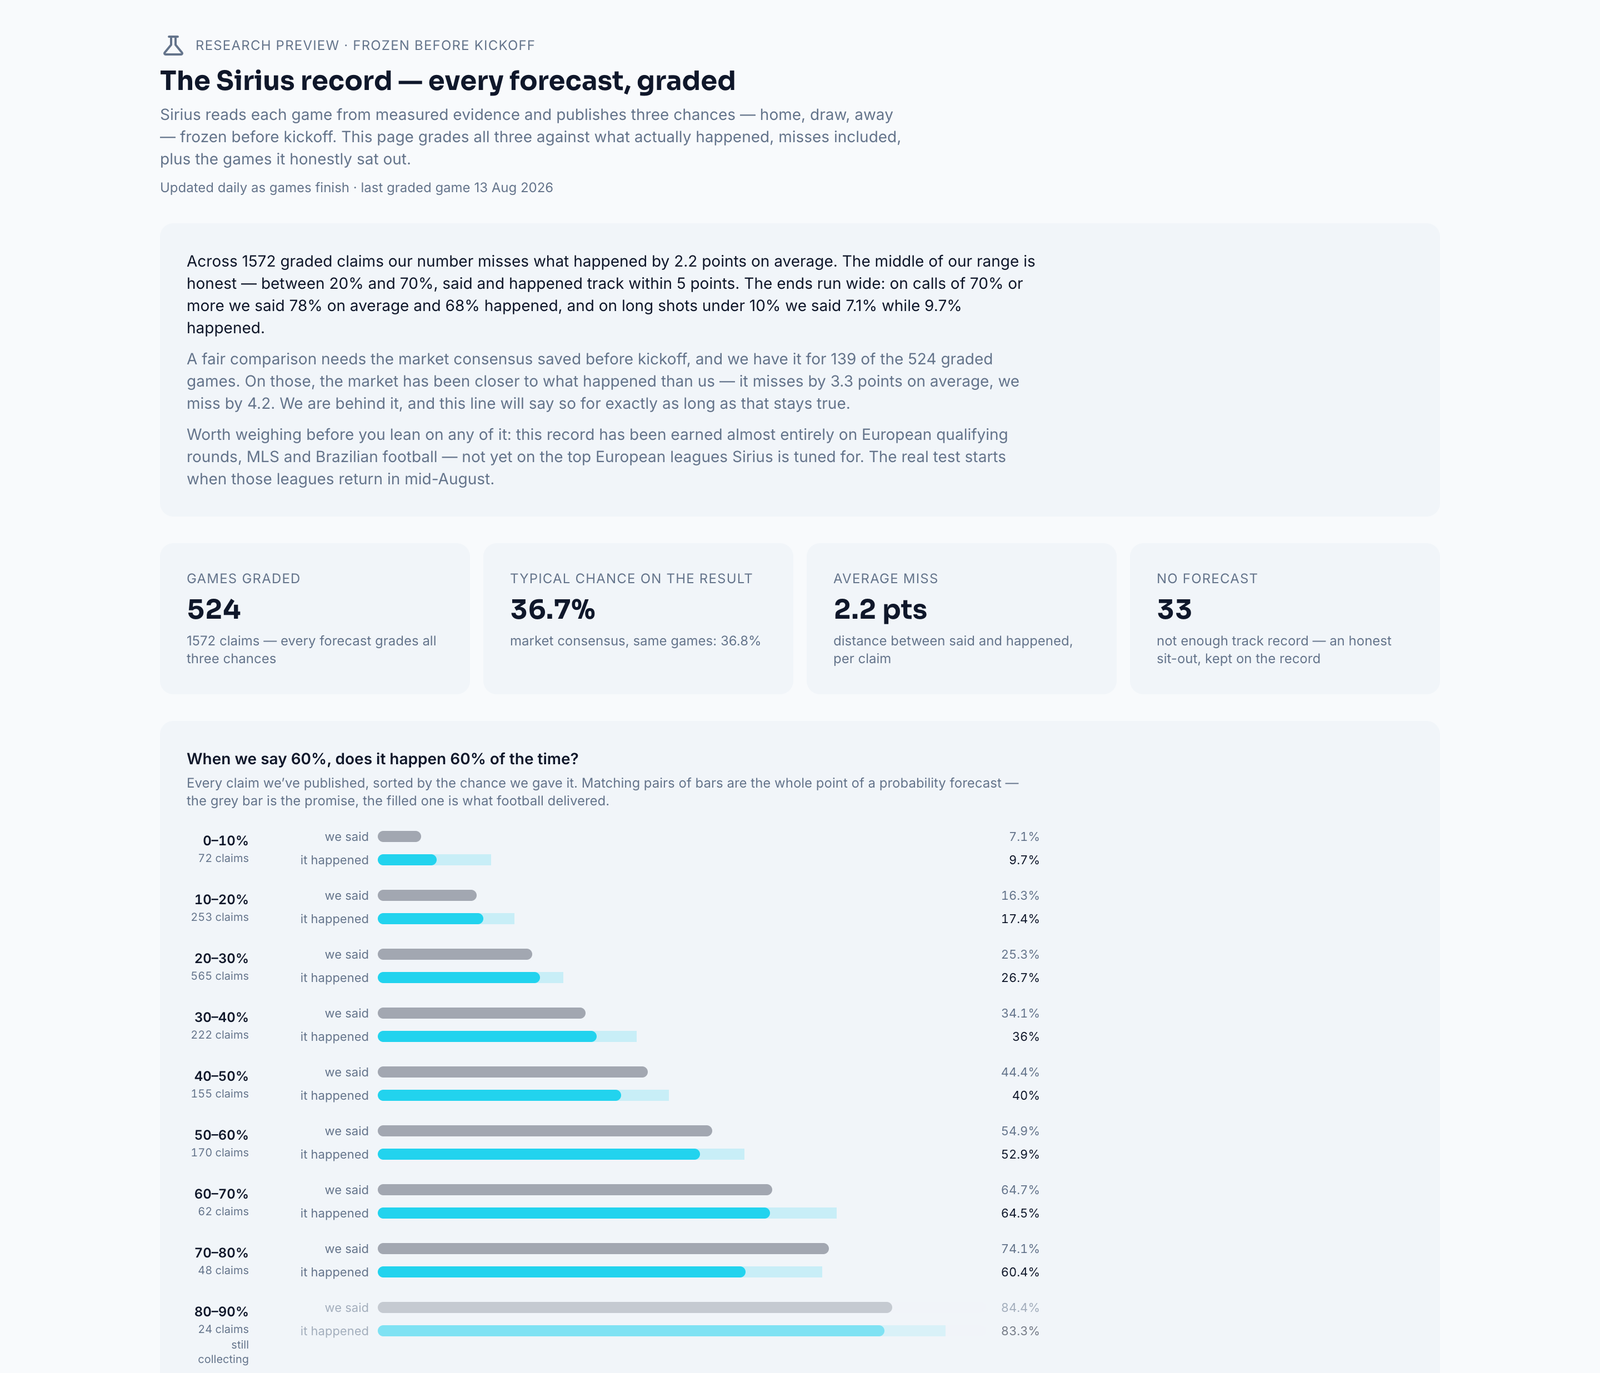
Each strip unfolds into a full public record. The Sirius record grades every match-result forecast ever frozen — the headline is how far our stated chances land from what happened, and the chart underneath asks the only question that matters for a probability: when we say 60%, does it happen 60% of the time?
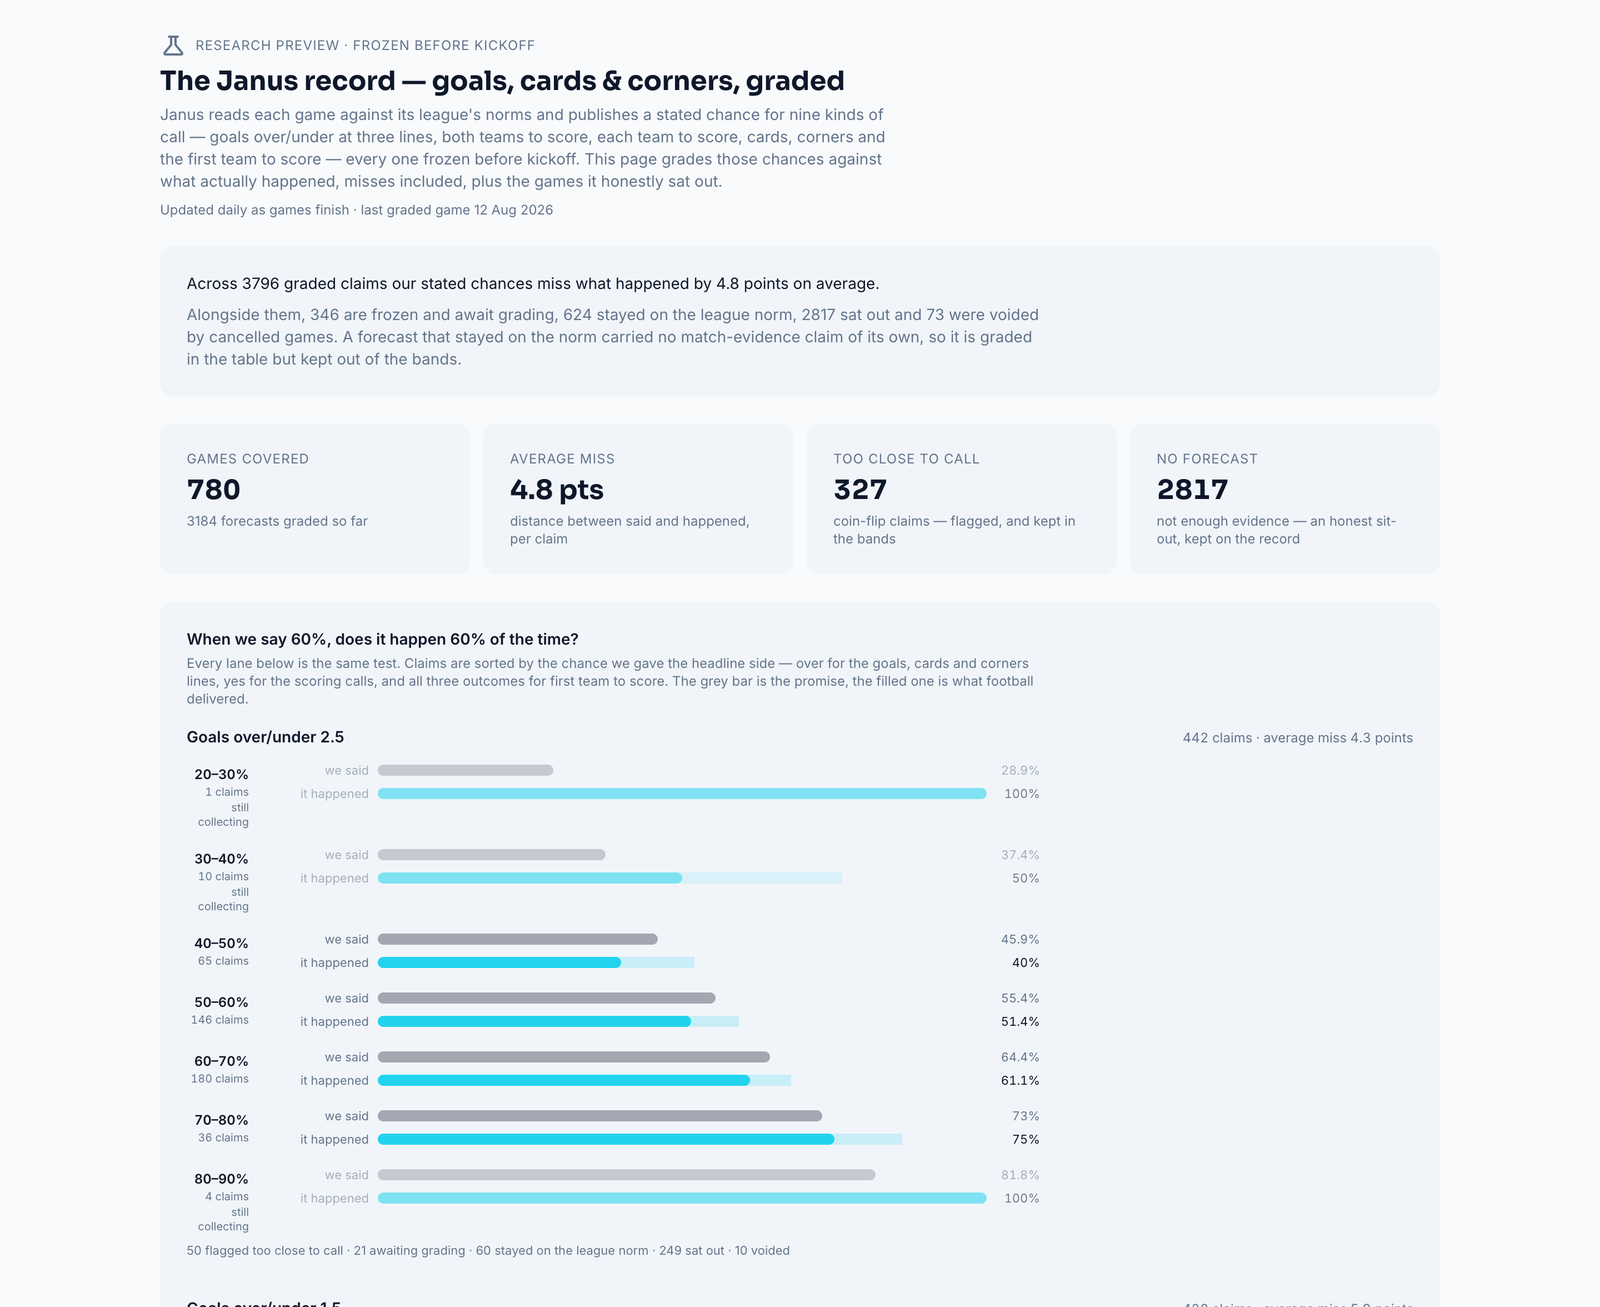
The goals, cards and corners forecasts get exactly the same treatment on the Janus record — thousands of graded claims across nine kinds of call, banded the same way, with too-close-to-call claims flagged and honest sit-outs kept on the record:
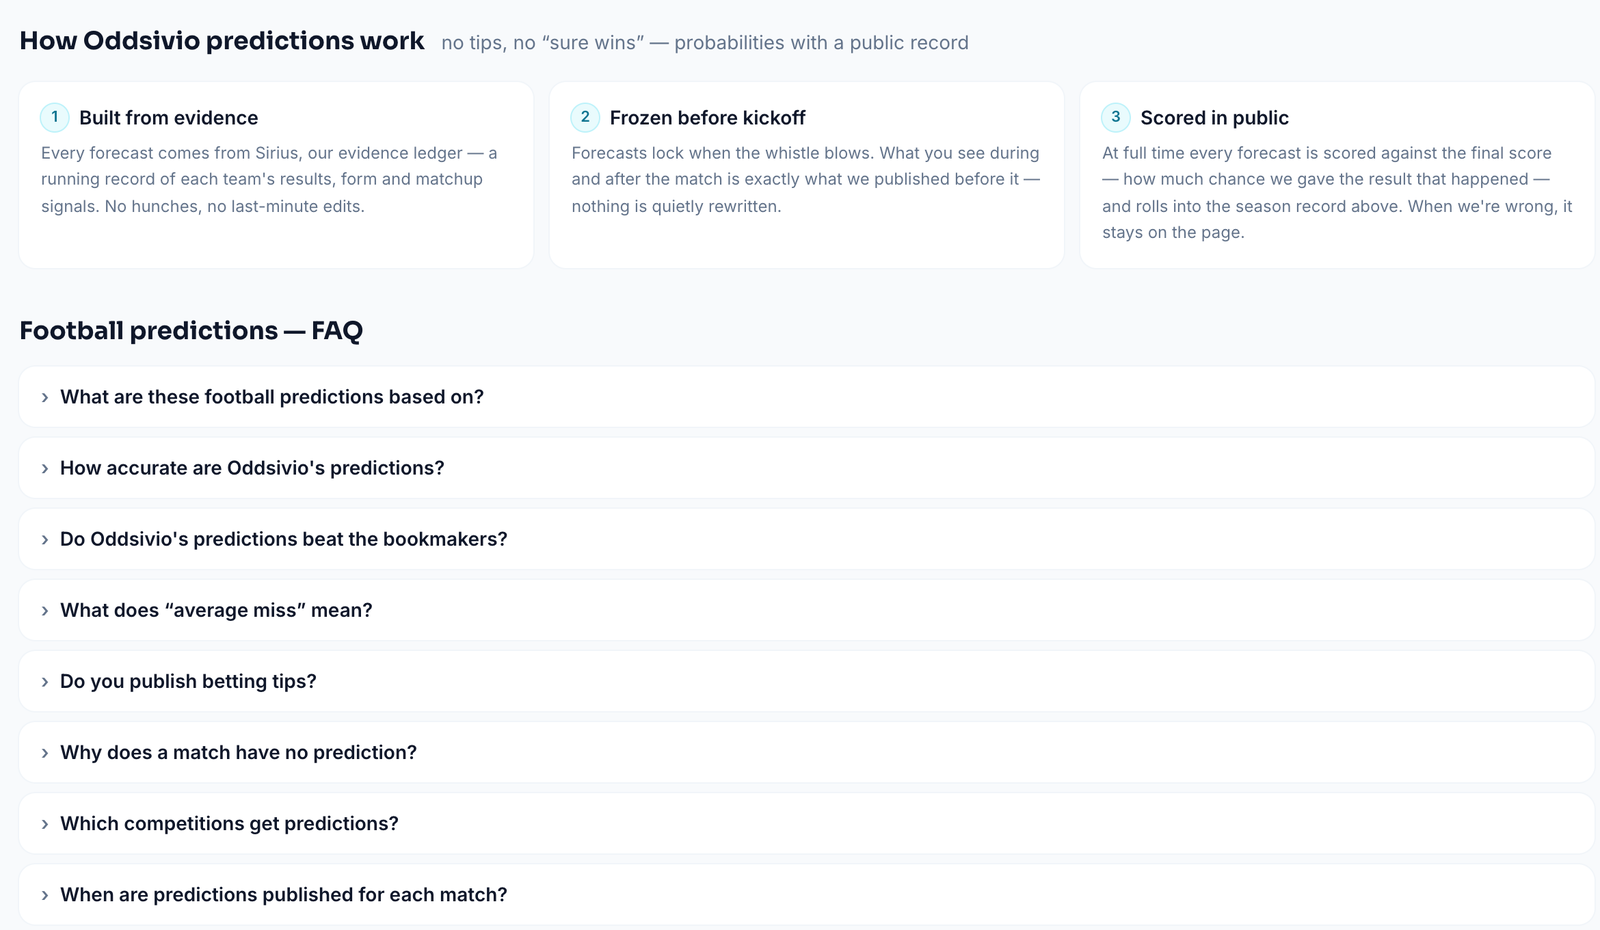
The same section of the Predictions page also spells out the method in three lines — built from evidence, frozen before kickoff, scored in public — and answers the questions we get most:
The part we'll say plainly
Match Insights is analysis. It exists so that when you watch, discuss, or — if you're of age and it's legal where you live — bet on football, you do it with a clear-eyed read of the evidence instead of a hunch or a hot take.
It is not betting advice, and probabilities are not promises: a 68% forecast loses about a third of the time, by design. If you do bet: set limits before you start, never chase losses, and treat every stake as entertainment spend, not income. Our Responsible Gambling page has the ground rules, the warning signs, and free, confidential places to get help — it's linked in the footer of every page on the site.
Try it on this weekend's slate
That's the whole system: find a match, open Match Insights, read the forecast against the market, check the per-market calls against their norms, and drop down to the transparent statistics whenever you want to see the machinery. Then hold us to it on the record pages.
Start with today's matches or the Predictions feed — and if a forecast we publish tonight is wrong, you'll find it scored and public by morning. That's the deal.