Brier score, calibration and CLV: football prediction terms, explained
Brier score, calibration, baselines, closing line value — every football prediction term worth knowing, mapped to the plain-English labels Oddsivio uses, with live examples from our public record.
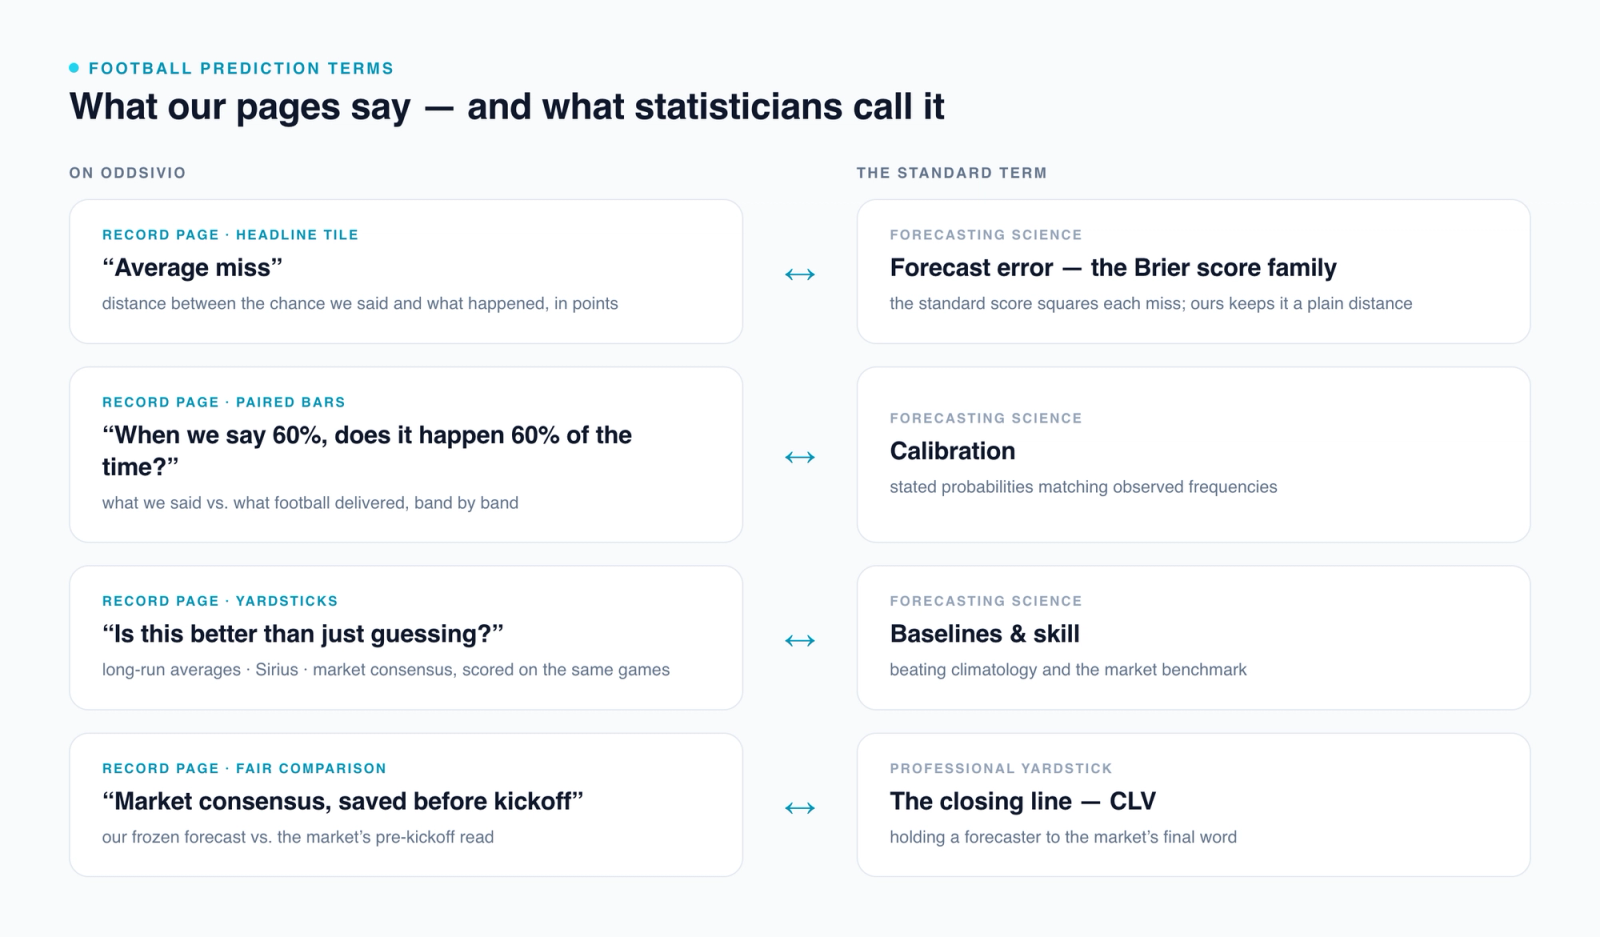
You will not find the words "Brier score" in a headline anywhere on Oddsivio — one fine-print footnote on the record page owns up to the name, and that's it. That's deliberate. Our pages speak plain football English — "average miss", "we gave it 42%", "Near coin-flip" — because a prediction you need a statistics degree to read isn't explaining anything.
But behind the plain English sits completely standard forecasting science, the same machinery weather services have used for decades. If you've ever searched what is a Brier score or what does calibration mean and landed in a wall of notation, this page is the bridge: every term, what it actually means, what we call it on Oddsivio, and exactly where you can see it live on our pages.
One thing before we start, because it frames everything below: Oddsivio does not publish betting tips. We publish probability forecasts with evidence attached, and a public record of every one — including the misses. The vocabulary on this page is the vocabulary of accountability: it exists so you can check whether a forecaster is any good, starting with us.
The terms are ordered the way a forecast lives: it's born as three numbers, frozen at kickoff, scored at full time, judged in bulk on the record — and finally measured against the market.
What is a probability forecast?
A probability forecast doesn't say what will happen — it says how likely each outcome is. For a football match that means three numbers: the chance of a home win, a draw, and an away win, adding up to 100%. Say we publish 60–25–15 on a game: a 60% chance the home side wins, 25% the draw, 15% the away side. All three numbers are the forecast. Not just the big one.
That's the fundamental difference from a "prediction" in the everyday sense. A pundit's prediction is a pick; it's either right or wrong. A probability forecast is a claim about likelihood, and it expects to be "wrong" a precise fraction of the time — a 60% call should lose four times out of ten, by design. Everything else on this page follows from taking that seriously.
Where you'll see it: on every covered match page under Match Insights, as a three-way bar with the chance on each outcome, and on each card in the Predictions feed under the "Our forecast" eyebrow.
"Most likely" is a headline, not the whole forecast
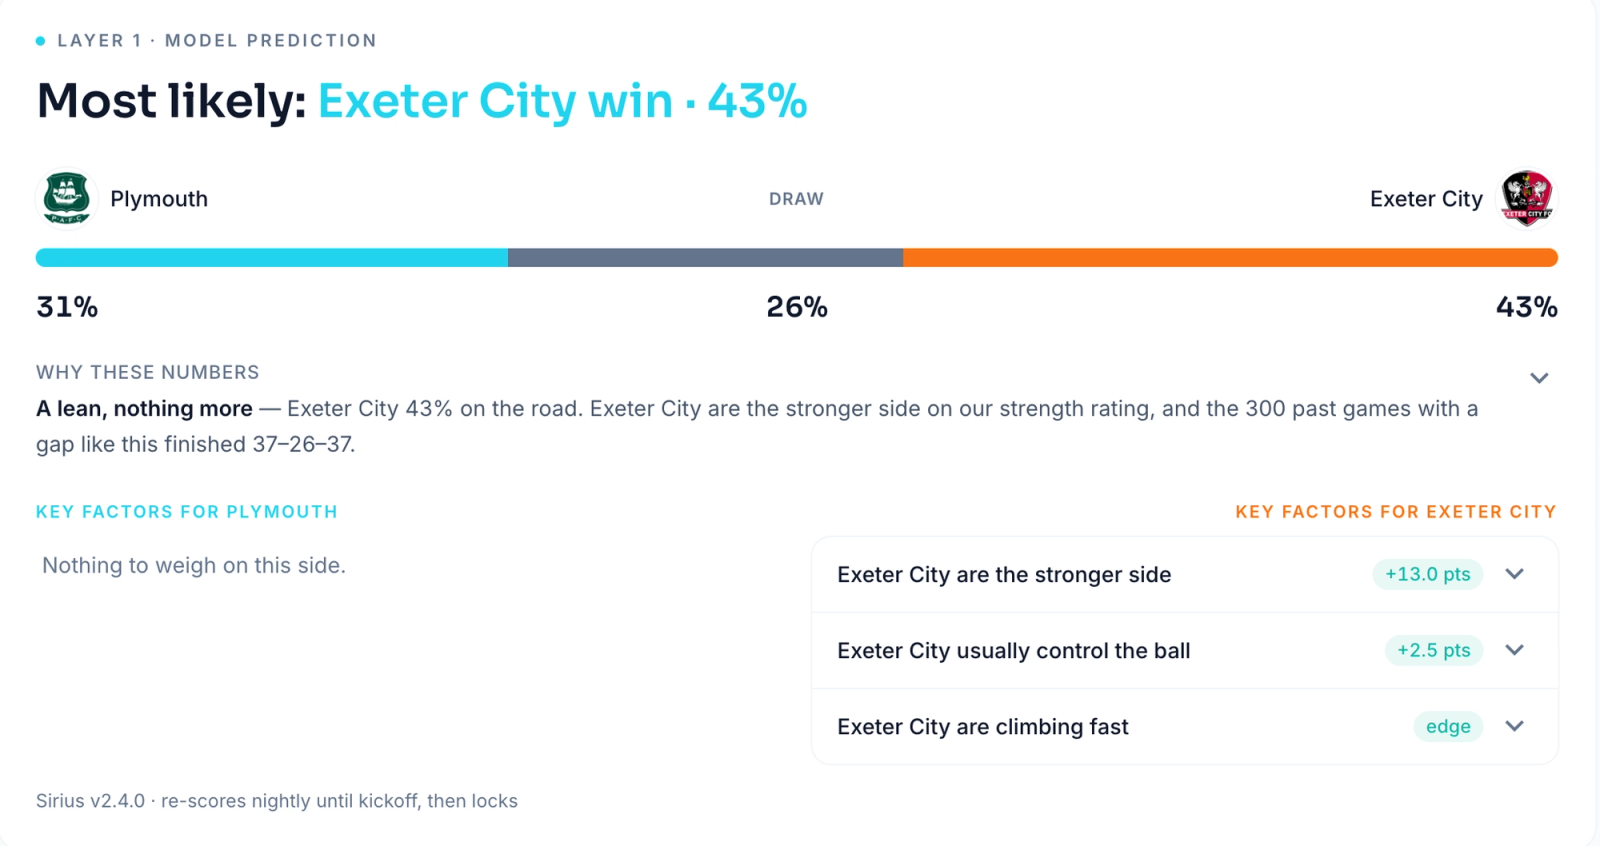
Above the bar you'll see a line like the one in the screenshot: "Most likely: Exeter City win · 43%". That's a summary for people scanning, not the forecast itself. "Most likely" means exactly what it says — the outcome with the biggest number — and nothing more. Look at that example closely: 43% is the biggest of the three chances, and it still means the most likely outcome is more likely not to happen than to happen. That's not a broken forecast; that's football, a three-outcome sport where draws eat probability.
This matters because most prediction sites collapse the whole forecast into that one pick and then count how often the pick "hit". We deliberately don't: we score all three numbers against what happened (more on scoring below). A forecaster can top the most-likely hit-rate table while publishing badly exaggerated probabilities — the hit rate can't see the difference. Our record page keeps most-likely hits as a footnote, and scores the whole distribution instead.
Where you'll see it: the headline of every forecast — match page, feed card, homepage.
What does "Near coin-flip" mean?
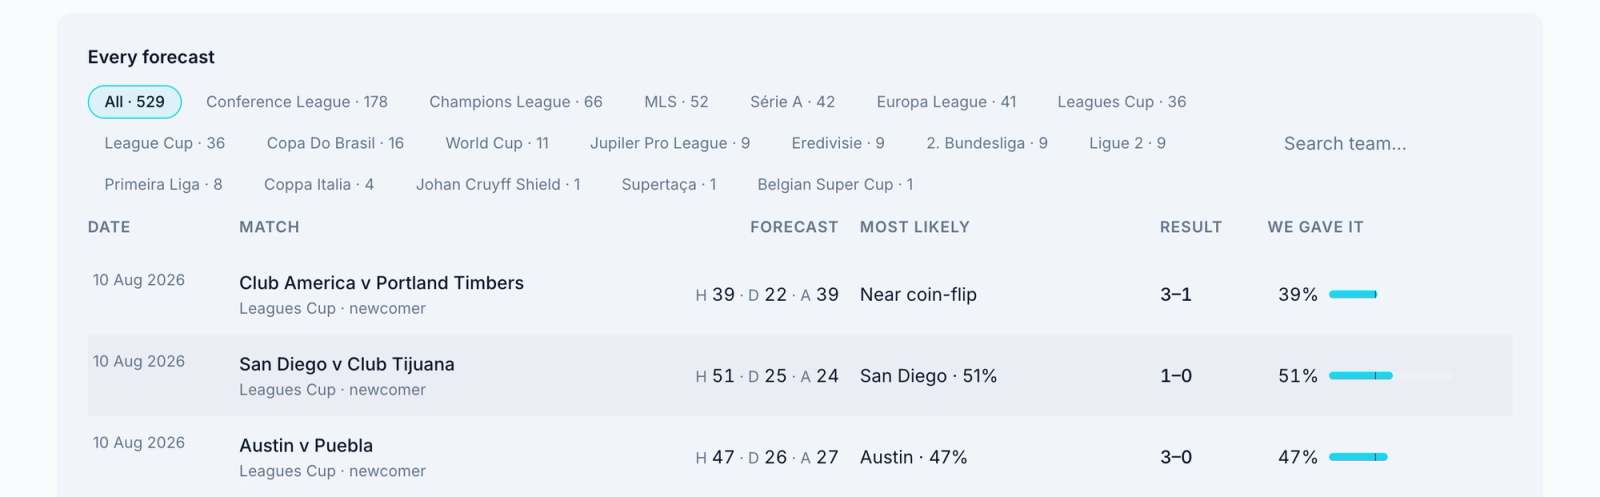
"Near coin-flip" is a warning label. It appears when the top outcomes are so close together that the "most likely" label stops meaning much. The record table below has a perfect live specimen: a forecast of 39–22–39, home and away chances exactly level. The forecast still has content — it says the draw is the least likely of the three — but naming a winner would be manufacturing confidence we don't have, so the "Most likely" column says "Near coin-flip" instead.
Honest forecasting means saying "this one's genuinely close" out loud rather than manufacturing a confident-sounding pick. Football is a low-scoring, high-variance sport; a big share of matches are near coin-flips, and any site that never says so is hiding it.
Where you'll see it: as a chip next to the "Most likely" line on feed cards and match pages, and in the "Most likely" column of the full record table.
What does "frozen before kickoff" mean?
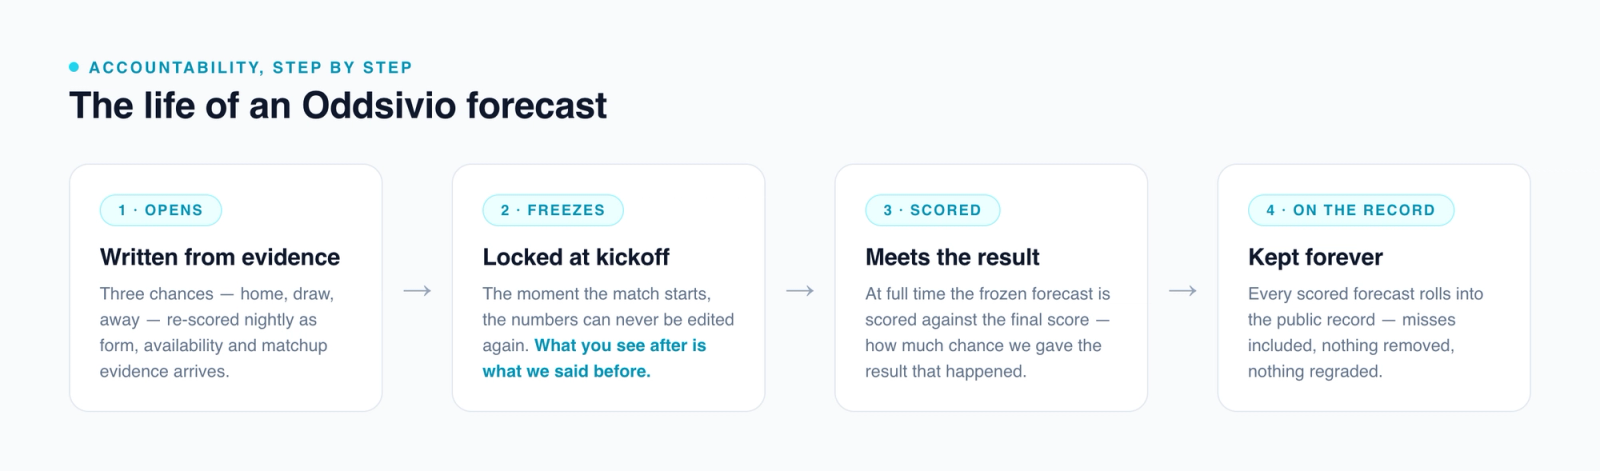
A frozen forecast is one that can never be edited again. Ours re-computes as evidence arrives — form, availability, matchup signals — right up to kickoff. The moment the match starts, the numbers lock: what you see during and after the game is exactly what we published before it, and that frozen version is what gets scored and kept on the permanent record. Nothing is quietly rewritten, nothing is removed, nothing is re-scored later.
Science has a name for this discipline — pre-registration: state your prediction before the experiment, in writing, so you can't move the goalposts afterwards. Without freezing, a track record is unverifiable; any site can look brilliant in hindsight if its predictions are editable.
Where you'll see it: the "Locked" stamp and the "locked {date, time}" footer on match cards in the Predictions feed, the small print on every match panel — "re-scores nightly until kickoff, then locks" — and the pledge on the record page: every number written before kickoff, nothing removed, nothing regraded.
What does "scored" mean? (and "We gave it")
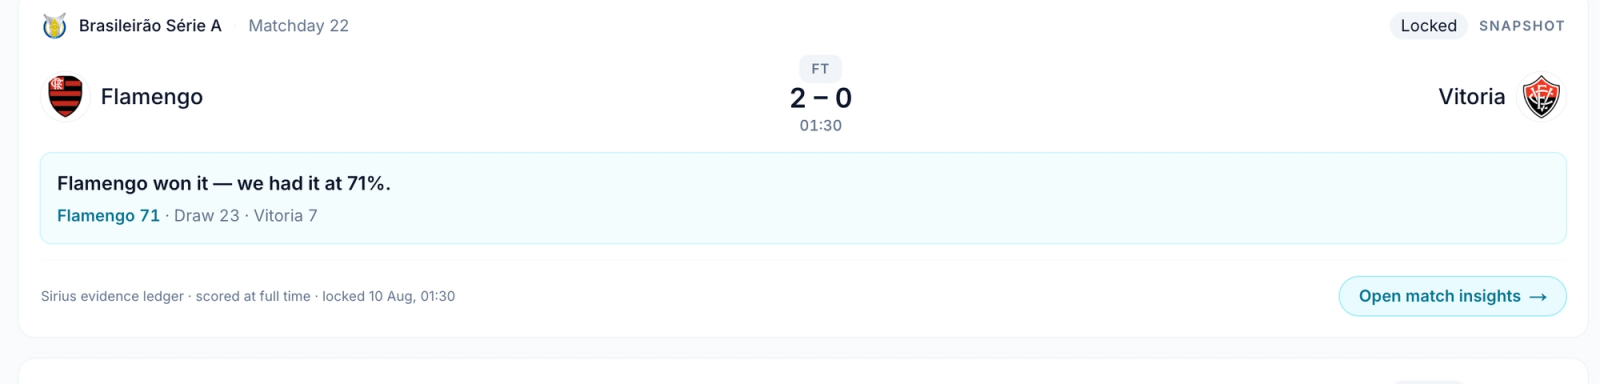
Scoring is the moment of accountability: at full time, the frozen forecast meets the actual result. The plainest way to score a single game — the one our pages lead with — is to ask: how much chance did we give the result that actually happened? If we published 60–25–15 and the home side won, we gave the result 60%. If the away side won instead, we gave it 15%.
You'll see this as "We gave it" on the record table and as a plain sentence on finished matches — in the screenshot below, "Flamengo won it — we had it at 71%." A perfect clairvoyant would score 100 every time; no honest forecaster gets near that. And one game proves nothing either way — a 42% result landing is not a triumph, an 18% one is not a disaster. Single games are weather; the record is climate. That's why the serious judgement happens in bulk, which is where the next three terms come in.
(You'll see both "scored" and "graded" around our pages — same act, older and newer wording.)
Where you'll see it: the ribbon on finished matches in the feed, the final-score chip on match pages, and the "We gave it" column on the record page.
What is "average miss"?
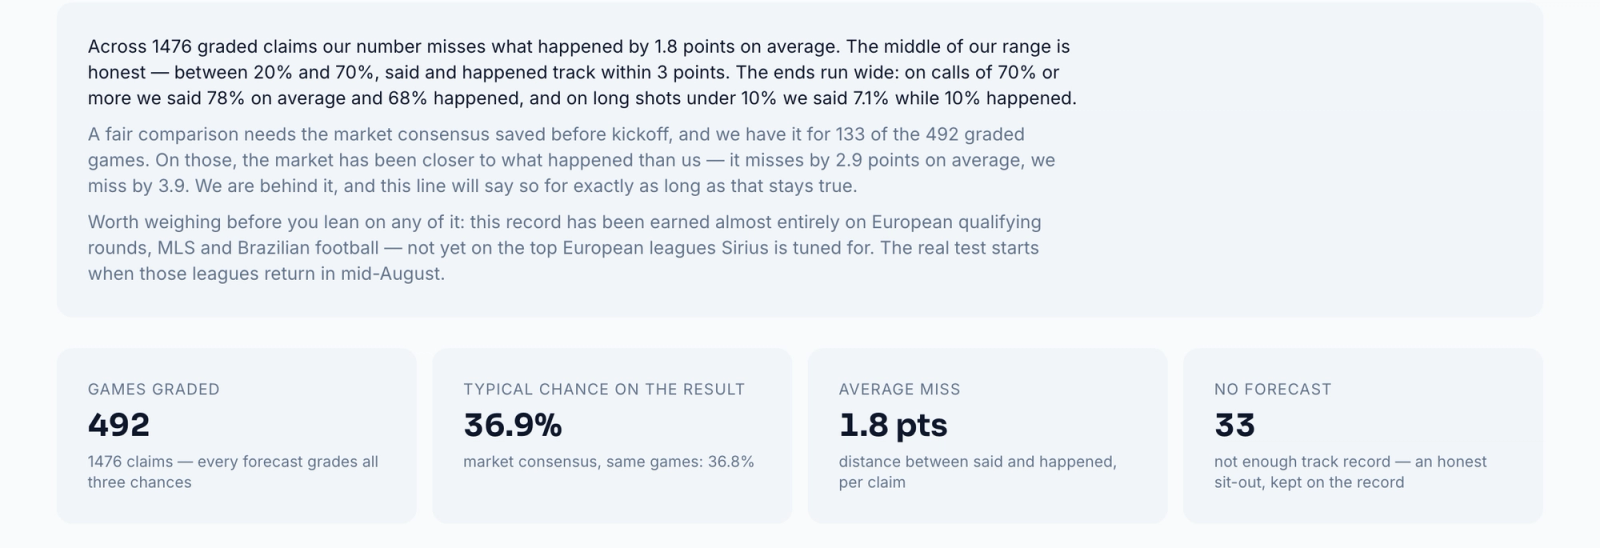
Average miss is our headline accuracy number: how far, in points of probability, our stated chances sat from what actually happened — averaged over every claim on the record. If we keep saying 60% and results land as if the true figure were 55%, we're missing by about 5 points there. Lower is better; zero is unreachable.
It's deliberately the plainest possible error measure — a distance, in the same units as the forecast itself. It has a more formal cousin (the Brier score, next entry): average miss trades a little statistical rigour for being instantly readable, and our record page shows it front and centre while the formal score does the heavy lifting one section further down.
Note what leading with a miss number does: it makes the headline metric one where we admit error in every unit. There is no way to say "we miss by 4 points on average" while pretending to be infallible.
Where you'll see it: the "Average miss" tile at the top of the record page, and the record strip on the Predictions feed — "every forecast scored, misses included".
What is a Brier score?
The Brier score is the standard accuracy score for probability forecasts, introduced by the meteorologist Glenn Brier in 1950 to grade weather forecasts. It measures the gap between what you forecast and what happened, squared — so being confidently wrong hurts much more than being cautiously wrong. Lower is better.
For a three-outcome forecast it works like this: after the match, the true result is written as 1 and the other outcomes as 0, and each forecast probability's distance from those is squared and added up. Take our 60–25–15 example and a home win: the gaps are 0.40, 0.25 and 0.15, and the score is 0.40² + 0.25² + 0.15² = 0.245. Guessing a third on everything scores 0.667 on every match; a perfect clairvoyant scores 0. The squaring is the point: claim 95% on something that doesn't happen and the penalty is severe, which is exactly the discipline that keeps probability-mongers honest.
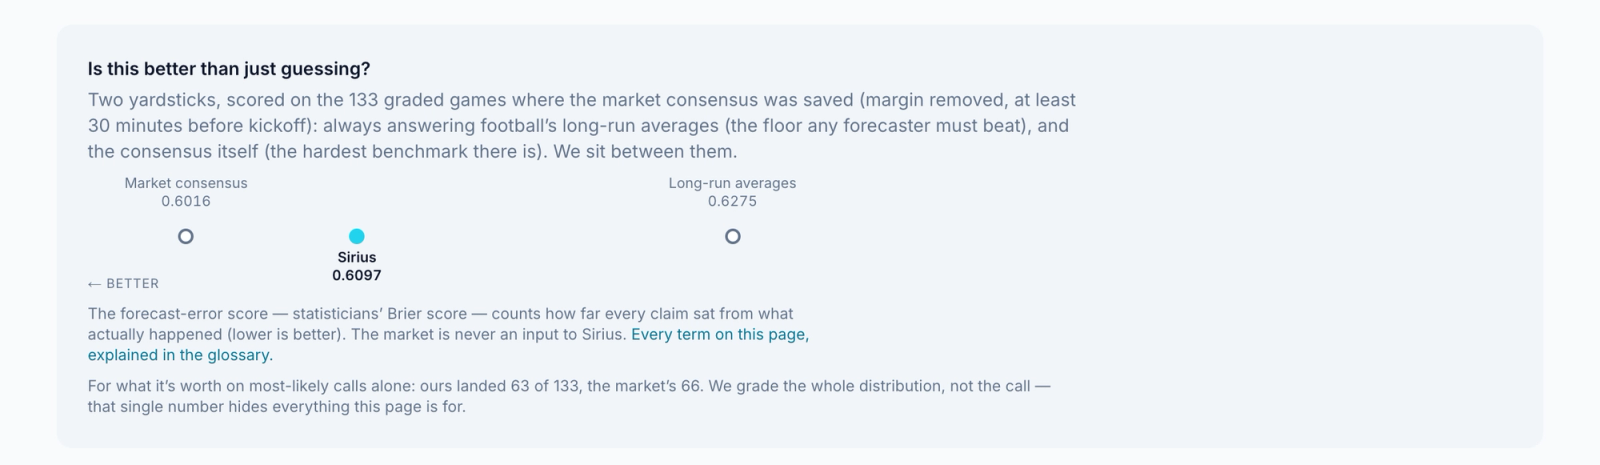
On Oddsivio you'll meet the Brier score almost without its name: our record page calls it "the forecast-error score" and uses it to power the "Is this better than just guessing?" comparison — us against the market against long-run averages, all scored on the same games. One fine-print line under that chart owns up to the standard name; everywhere else it's plain-English label on the surface, textbook Brier underneath.
Where you'll see it: the yardstick chart on the record page, labelled "forecast-error score — lower is better".
What is a baseline? (and what "skill" means)
A baseline is the score you'd get without any real insight — and it's the only thing that gives an accuracy number meaning. "We miss by 4 points" or "Brier 0.21" is uninterpretable on its own; the question is always compared to what?
Forecasting has a standard ladder of baselines. The floor is long-run averages: always answering with football's historical outcome rates — home sides win roughly 45% of matches, draws take roughly a quarter — never looking at the teams at all. (Weather forecasters call this "climatology": predict the seasonal average every day.) Any forecaster who can't beat the long-run averages has learned nothing. At the other end sits the market consensus — the probabilities implied by dozens of bookmakers' prices, sharpened by millions in real-money disagreement. It is the hardest public benchmark there is, and most published models never beat it.
Skill, in the technical sense, just means scoring better than a baseline. Our record page shows the whole ladder honestly: long-run averages, Sirius, and the market consensus on the same axis, scored on the same games — and it tells you plainly where we currently sit, for exactly as long as that's where we sit.
Where you'll see it: the "Is this better than just guessing?" section of the record page.
What is calibration?
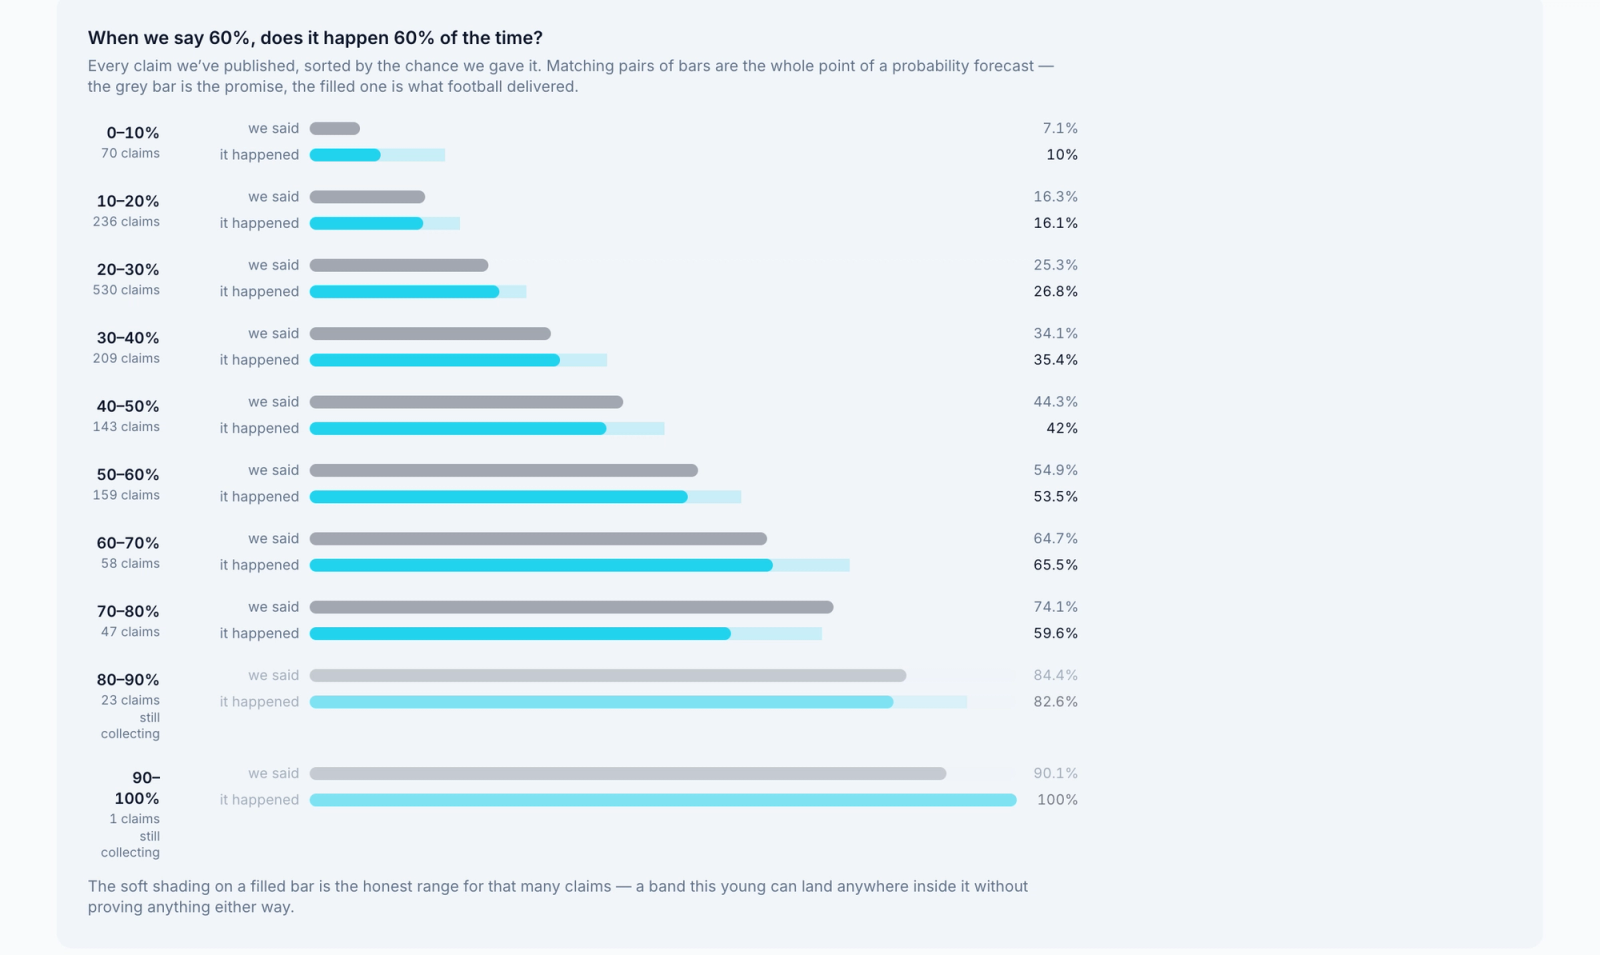
Calibration asks the most natural question you can ask a probability forecaster: when you say 60%, does it actually happen about 60% of the time? Not on one match — over every claim you've ever made at around that level.
To check it, you gather every published claim, sort them into bands by stated chance (all the ~30% claims together, all the ~60% claims together…), and compare each band's average stated chance with how often those outcomes actually happened. A calibrated forecaster's pairs match all the way up the scale. The classic failure is overconfidence at the extremes: 80% claims that land 65% of the time, 5% long shots that hit 12% — the fingerprint of a forecaster overstating how much they know.
Our record page draws exactly this chart and titles it with the question itself: "When we say 60%, does it happen 60% of the time?" Grey bar: what we said. Filled bar: what football delivered. Matching pairs are the whole point of a probability forecast — and where they don't match, the page says so in a sentence we can't edit, because it's generated from the data.
Where you'll see it: the bands section of the record page, one pair of bars per chance band.
Why sample size matters (the "honest range" and the 300-claim gate)
Every number above is only as trustworthy as the number of games behind it. Flip a fair coin 20 times and it will happily come up heads 65% of the time; watch a calibration band with 15 claims in it land 10 points off its promise and you've learned almost nothing. Small samples generate impressive-looking numbers — good and bad — out of pure noise.
Our pages carry that humility structurally rather than in a disclaimer. Young calibration bands are marked "still collecting", and each filled bar carries a soft-shaded honest range: the span a band of that size could land in without proving anything either way. And the record's headline number is held behind a 300-claim gate — below 300 scored claims the page shows the counts but refuses to promote a headline, because a young record flattering us is worth exactly as much as a young record embarrassing us.
When you evaluate any forecaster — us included — the first number to find is not the accuracy figure. It's the number of forecasts behind it.
Where you'll see it: the shading and "still collecting" tags on the record page bands, and the young-record notice that holds the headline until 300 claims are on the books.

What does "No forecast" mean?
Sometimes the honest forecast is no forecast. When we haven't tracked both sides long enough to rate them credibly — newly promoted teams, sides new to our coverage — the card says so: "No forecast — we don't know these sides well enough." No numbers, no hedge, and the sit-out is counted on the record like everything else.
Abstaining is a feature, not a gap. A model that must produce a confident number for every fixture will quietly produce garbage for the fixtures it knows least about — and a tips site has every incentive to do exactly that, because content is content. Counting our sit-outs publicly is what makes the rest of the record mean something: you can see we didn't skip the hard ones and keep the flattering ones.
Where you'll see it: occasional cards in the Predictions feed — "No forecast — we don't know these sides well enough" — and the "No forecast" tile and rows on the record page.

What is market-implied probability?
Bookmaker odds are probabilities wearing a disguise. Decimal odds of 2.00 imply a 50% chance (1 ÷ 2.00); odds of 4.00 imply 25%. Convert a match's three prices this way and you get the market's own probability forecast for the game — that's market-implied probability.
One honest wrinkle: raw implied probabilities on a match add up to more than 100% — typically 103–108% — because bookmakers build in a margin. To read the market's true opinion, that margin has to be stripped back out proportionally. When our pages talk about the market consensus, that's what it means: the implied probabilities of many bookmakers, margin removed, averaged — and saved before kickoff (each book's last price at least 30 minutes out), so the comparison against our frozen forecast is fair.
Why put the market on our own record page at all? Accountability, again. The consensus is the strongest public forecast in football, so we score it on the very same games we score ourselves, with the same forecast-error score — and print the comparison whichever way it comes out. This is analysis of the market, not an invitation to bet into it: it's on the page so you can judge us against the hardest benchmark, not so you can find a price.
Where you'll see it: "market consensus" throughout the record page — under the typical-chance tile, and as the toughest rung of the yardstick ladder.
What is closing line value (CLV)?
The closing line is the market's final price on a match, the moment before kickoff. It's the market's most informed forecast: every line-up leak, every late injury, every sharp disagreement has been traded into it by then. Study after study finds the closing line is, on average, the most accurate public estimate available — which is why it has become the professional yardstick.
Closing line value is the practice of grading a forecaster against that yardstick: did your probabilities, taken when you published them, consistently beat the market's final word? Sports-betting professionals treat sustained CLV as the early evidence of genuine skill, because it shows up long before profit can be separated from luck — you can be skilled and unlucky for months, but you can't beat the closing line for months by accident.
We don't currently publish a CLV number — Oddsivio doesn't sell picks, so "did we beat the price you could bet?" isn't our product question. But the closest honest relative is already on the record page: our frozen forecasts scored head-to-head against the pre-kickoff market consensus — a near-closing snapshot, taken at least 30 minutes before kickoff rather than at the market's literal final word — on the same games, with the same error score. Same spirit — hold the forecaster to the market's final word — expressed as analysis rather than advice. We've since taken this one step further in a dedicated piece: the closing line, explained — and how our forecasts measure up against it, with real numbers from our ledger and the honest reasons the record page doesn't chart a closing yardstick yet. If you're evaluating anyone who does sell predictions, ask them for their CLV or its equivalent. Silence is an answer.
Where you'll see it: not on Oddsivio today, by design — the market-consensus comparison on the record page is our accountability equivalent.
All of it, on three pages
Everything above lives on three pages, each one level deeper:
- A match page → Match Insights — one game's forecast: the three-way bar, "Most likely", the evidence for and against, and at full time the score we gave the result. Start here for any single match. (Full walkthrough: How to read Match Insights.)
- The Predictions feed — every forecast we're publishing today, locked stamps and scored ribbons included, with the live record strip at the bottom.
- The record page — the whole ledger: average miss, the Brier-scored yardstick ladder, the calibration bands, every claim ever frozen, misses kept forever.

And if you want the story of what the model actually weighs to produce these numbers, that's its own guide: How Sirius works.
The part we'll say plainly
This vocabulary exists so you can check forecasters instead of trusting them — us first. Probabilities are not promises: a 60% call fails four times in ten by design, and nothing on this page changes that.
None of it is betting advice. If you are of age, it's legal where you live, and you choose to bet: set limits before you start, never chase losses, and treat every stake as entertainment spend, not income. Our Responsible Gambling page has the ground rules, the warning signs, and free, confidential places to get help — it's linked in the footer of every page on the site.
The next time a site shows you a confident pick, you now know the six questions that expose it: What probability, exactly? Was it frozen before kickoff? Scored afterwards — misses included? Calibrated over how many forecasts? Better than which baseline? And would it have beaten the closing line? Our answers are public on the record page — every forecast, scored, nothing removed.